Let’s Talk Streaming Graph! (with demo)
TGIF! Let’s Talk (streaming graph) Data
On Friday, 11 March Ryan Wright sat down with Joe Reis and Matt Housley, CEO and CTO respectively of Ternary Data, to discuss Quine, the open source streaming graph. What followed was an hour of remarkably incisive questions and well-informed discussion. In addition to the video, we’ve pulled out the transcript of some particularly good bits. If you like this, give Joe and Matt’s show a follow.
Excerpt One 0:46
Joe (Ternary):
I’m sorry, what the heck is a streaming graph?
Ryan (thatDot, Quine):
So it’s kind of like, imagine the unholy love child of Apache Kafka and Neo4J… something sort of like a graph database, but aimed at high volume event stream processing. The goal is really to interpret what does that data stream mean? Like the data in that high volume event stream. What does it mean? And that’s what we build big micro service architectures for.
Quine is this standalone application meant to help make that process a whole lot easier. So the idea is basically you can consume that event data, form it into a graph, because the graph is so expressive, and so powerful, to look at and relate data to each other and analyze it, except that it’s really fast. And that’s really been the linchpin for the database mindset: [people think] graph DBs are cool, but they’re too slow. So Quine is trying to change that and bring fast streaming graphs that trigger action to the world of Event Stream Processing.
Excerpt Two 6:16
Matt (Ternary)
It’s interesting to me, too, that you’re, you’re solving these very hard graph problems. But you guys also decided to adopt a real time analysis model. And by that, I mean, people complain a lot about micro batch. Micro batches is often a perfectly good approach. But you’re saying basically, that not only can you process this graph, but you’re not doing it in like ten second micro batches, you’re actually taking each event and saying, Okay, this event arriving triggers or this this piece, this node triggers some kind of analysis that I can see things happening almost immediately. What kind of latency? Are we talking for that processing to happen?
Ryan:
Yeah, oh, great question. So we’ve, we’ve measured it, an to kind of set set the stage a little bit, the kind of thing that we’re typically looking for is, look for a graph pattern that is maybe four or five nodes connected in a certain kind of way. And so it’s each each node in that graph, you might think of as one row in a relational table, you know, there’s an equivalence there to say these are the same kinds of things. And so when you traverse an edge, you’re doing a join between tables to say…this row here is connected to that row in that table over there. And so it’s the kind of situation that is usually join, join, join, join, join, there’s your answer. And so to do lots of those (joins) is just untenable. And so the reason to go in the direction of a graph is because it gives us instead of having to join tables, we just get the small little units of a node. And so we can hop across four, five, six, ten, fifty, you know, any number of nodes, in a much more efficient way than if we’re joining tables together. And so what we’ve done and measured for some of our applications is: look for patterns that ar, four or five nodes, and then measure the latency that it takes to compute that in the single digit microseconds. So something like 8,000 or 9,000 nanoseconds has been some of the fastest stuff that we do. Which to anybody who’s worked in this space, you should have the response that is: ‘No way I don’t believe it.’
Joe:
[laughing] I don’t believe it.
Quine Demo
There’s also a demo if you’re interested, starting at the 40:21 mark.
If you want to learn more, check out the Quine.io docs and never hesitate to jump into the Quine Community Slack channel.
Related posts
-

The Secret Ingredient in the Alphabet Soup of Cybersecurity
This is the first in a series of blogs exploring how the Quine Streaming Graph analytics engine is the secret ingredient in the Alphabet Soup of cybersecurity, enabling…
-

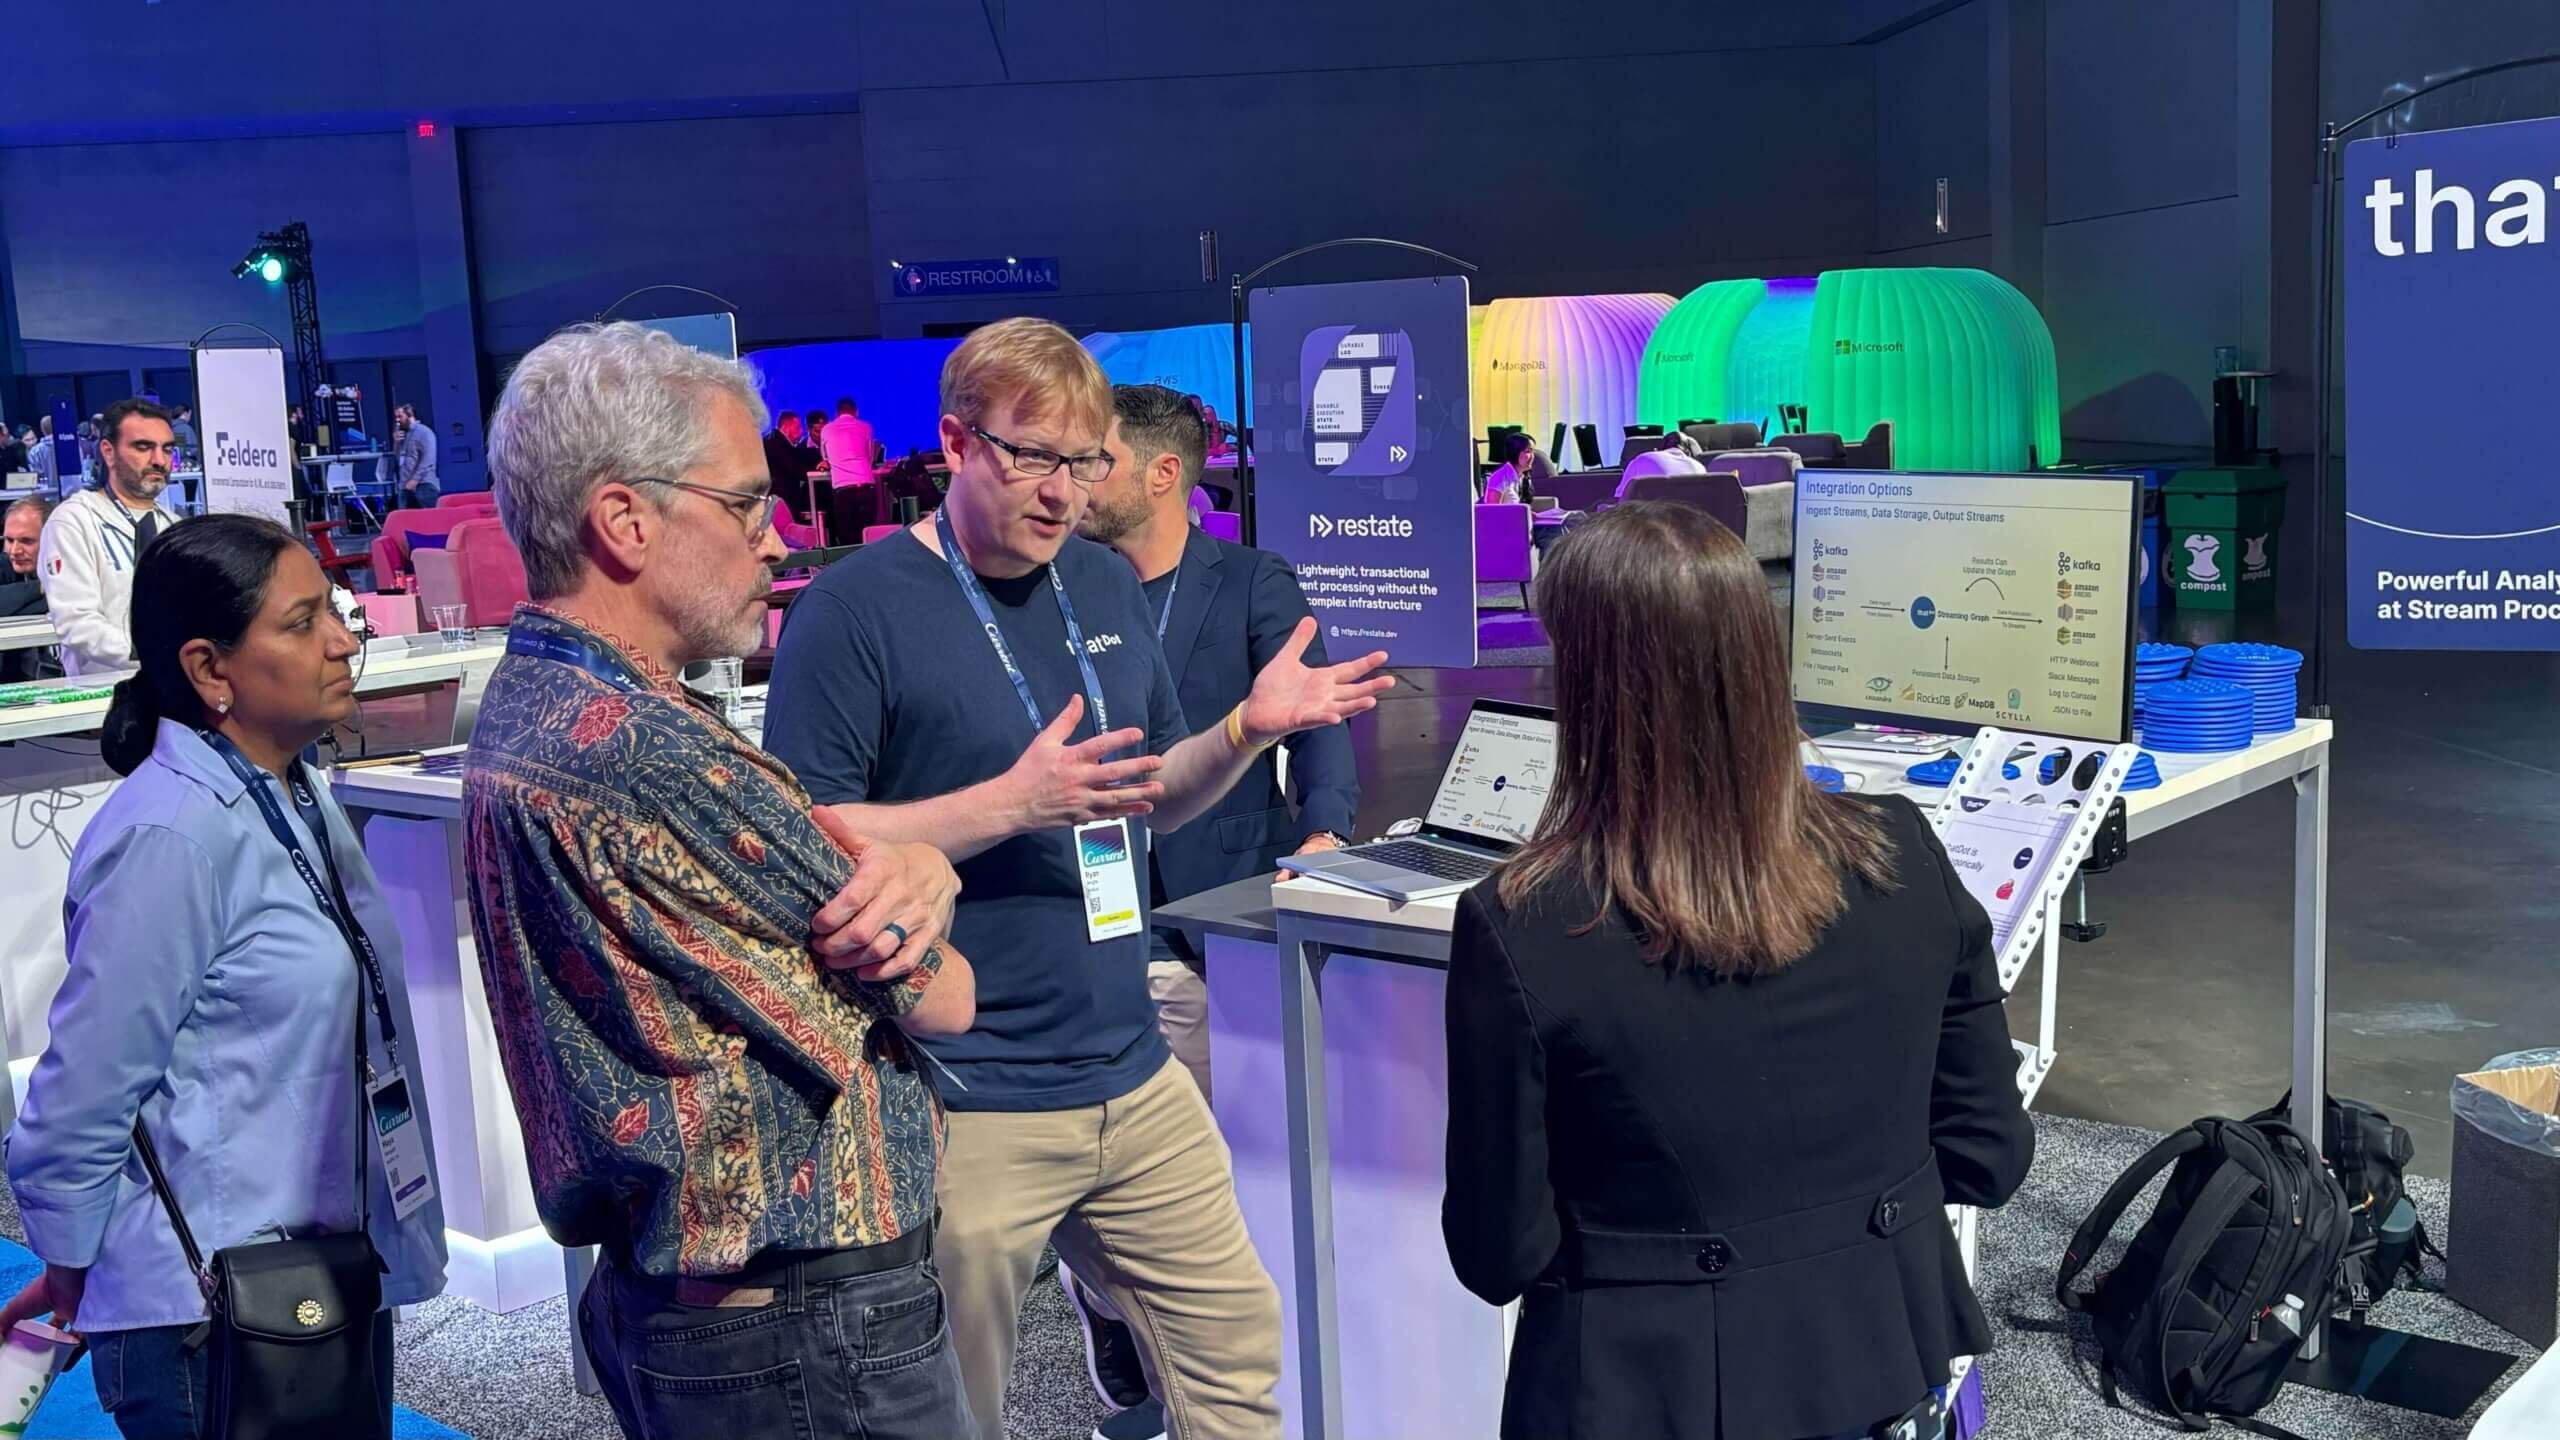
Stream Processing World Meets Streaming Graph at Current 2024
The thatDot team had a great time last week at Confluent’s big conference, Current 2024. We talked to a lot of folks about the power of Streaming Graph,…
-

Streaming Graph Get Started
It’s been said that graphs are everywhere. Graph-based data models provide a flexible and intuitive way to represent complex relationships and interconnectedness in data. They are particularly well-suited…
