Resource Hub : Blog
thatDot Blog
Announcements, updates, news, and more
Looking for help?
Browse our Help Center for helpful docs and demos.
Looking for further support? Join our very helpful community.
Recent Posts
-
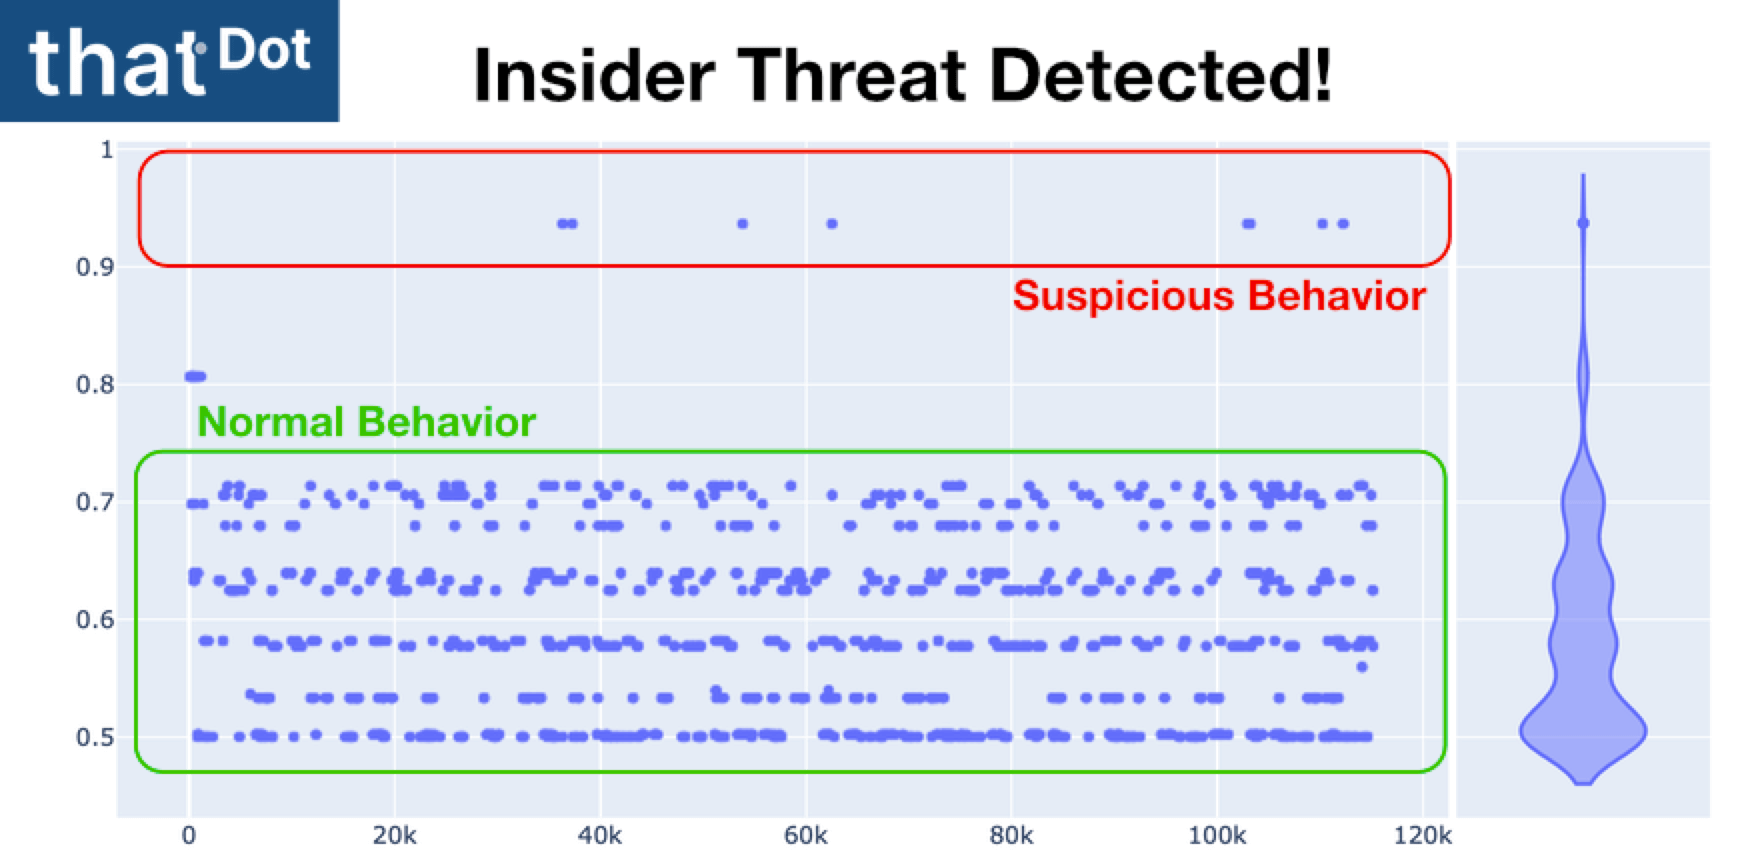
Stop Insider Threats With Automated Behavioral Anomaly Detection
Advanced: Finding a malicious employee is one of the toughest cyber-security challenges in the industry.
-
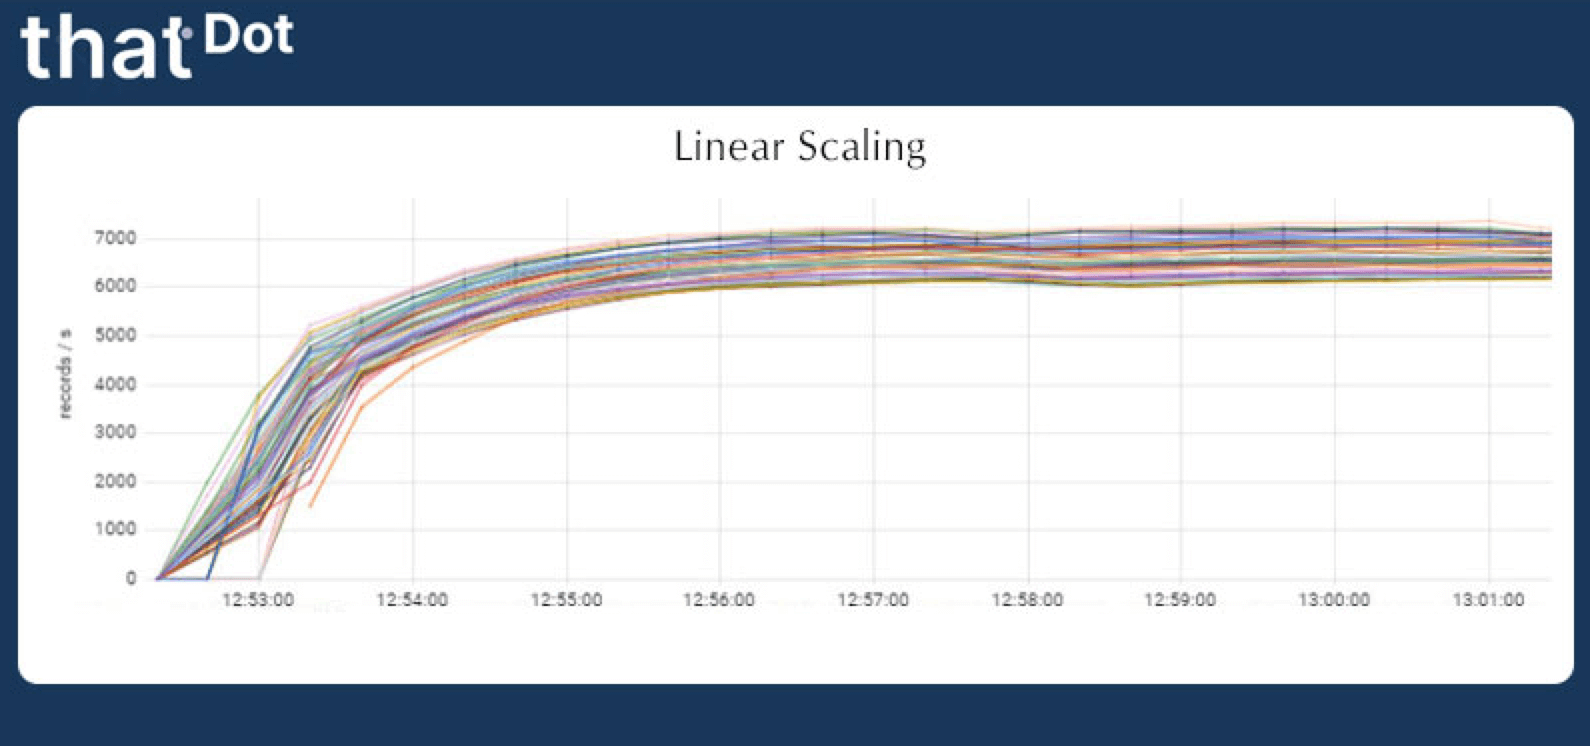
Quine Streaming Graph Scales to 1.1 Trillion Log Events per Month
Learn how Quine streaming graph achieved a sustained rate of recording 425,000 records per second into our streaming graph.
-
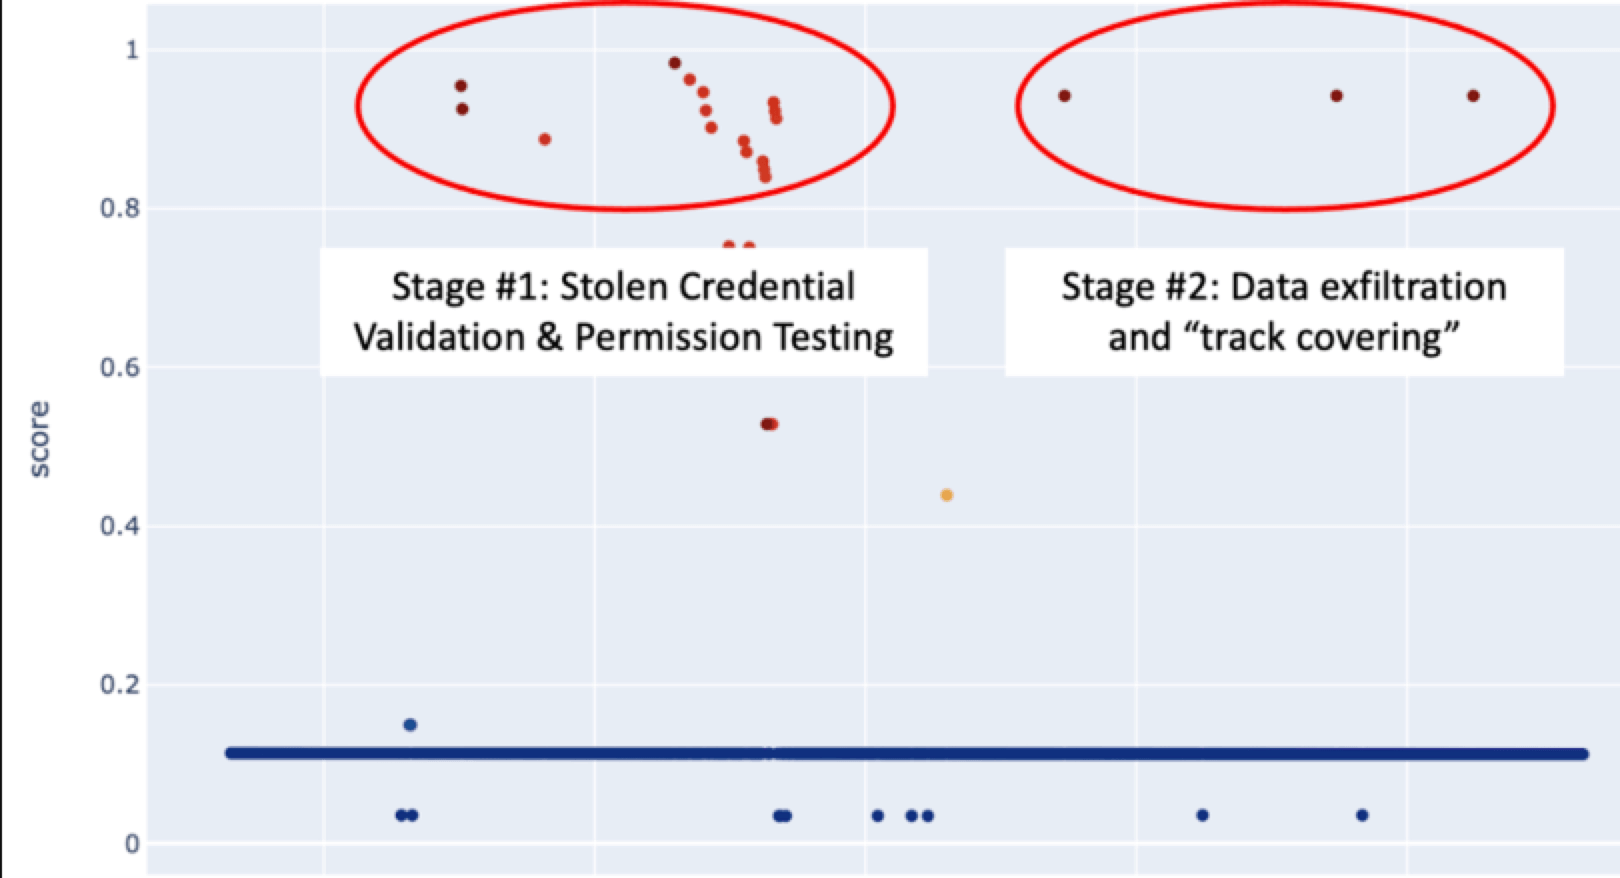
Data Exfiltration Detection in AWS CloudTrail Logs Using Categorical Data
This blog on AWS data exfiltration detection explains the use of categorical data in anomaly detection to identify multi-stage exploit campaigns in AWS CloudTrail logs.
-
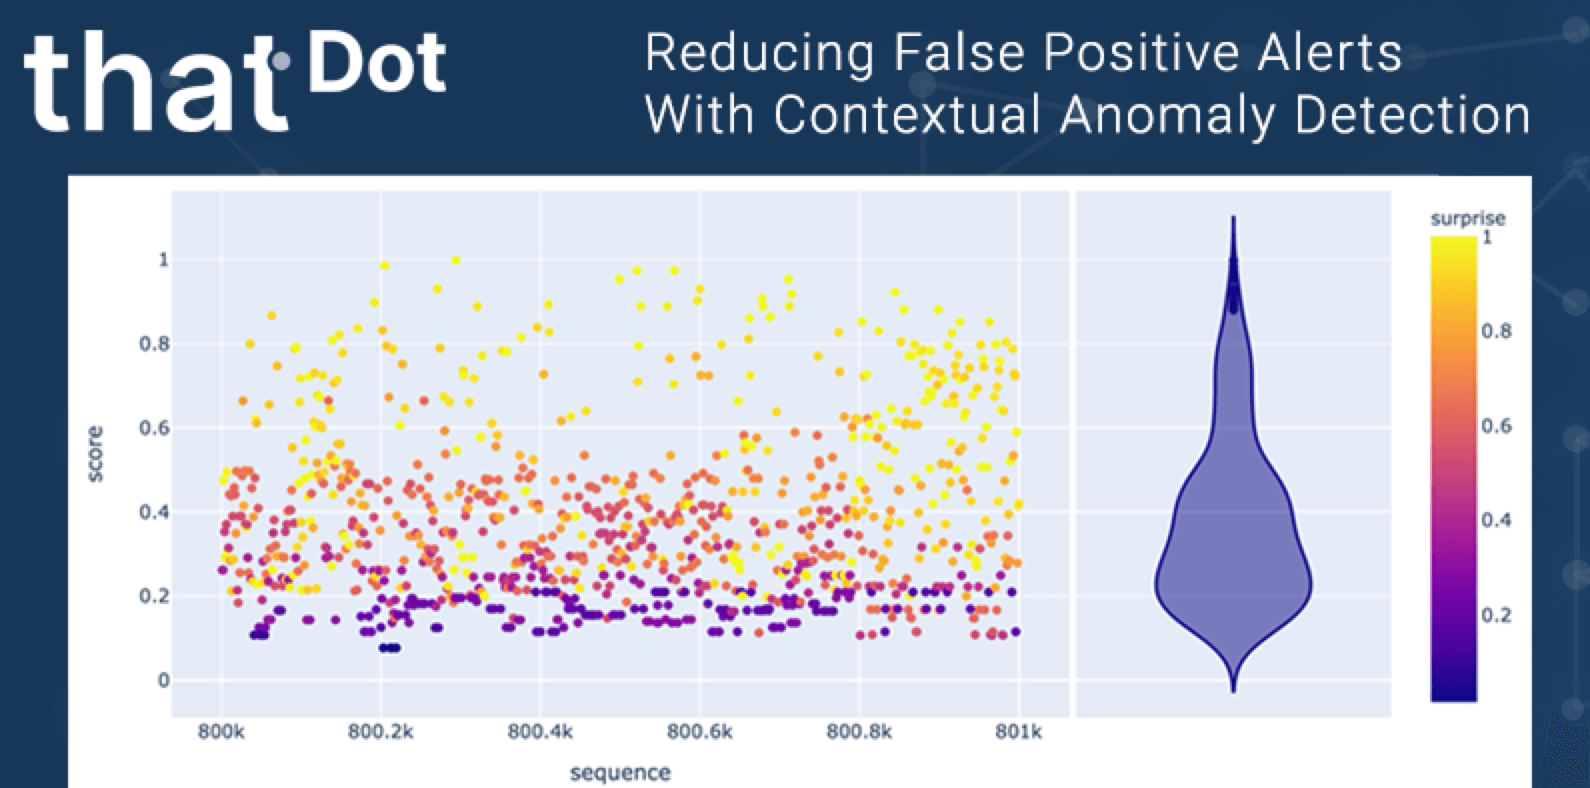
The Known Security Challenge of the Unknown
Destructive attack campaigns succeed because they integrate new techniques or new hardcoded credentials to access and victimize their targets.
-
Find Stolen Credentials Use in AWS CloudTrail Logs using Quine Graph
The move to the cloud represents new challenges for enterprise security teams. Use thatDot Novelty Detector to detect the attack quickly.
-

What Is Categorical Data? Comparing it to Numerical Data for Analytics
Data comes in two flavors: Numeric and Categorical. Numeric data is easy, it’s numbers. Categorical data is everything else.
-
New to Quine’s Novelty Detector: Visualizations and Enhancements
thatDot’s real-time Novelty Detector for categorical has updated its data exploration and data transformation capabilities.
-

The World’s First Real-time Novelty Detector For Categorical Data
thatDot is excited to share the general availability of the world’s first system for real-time categorical anomaly detection.
-
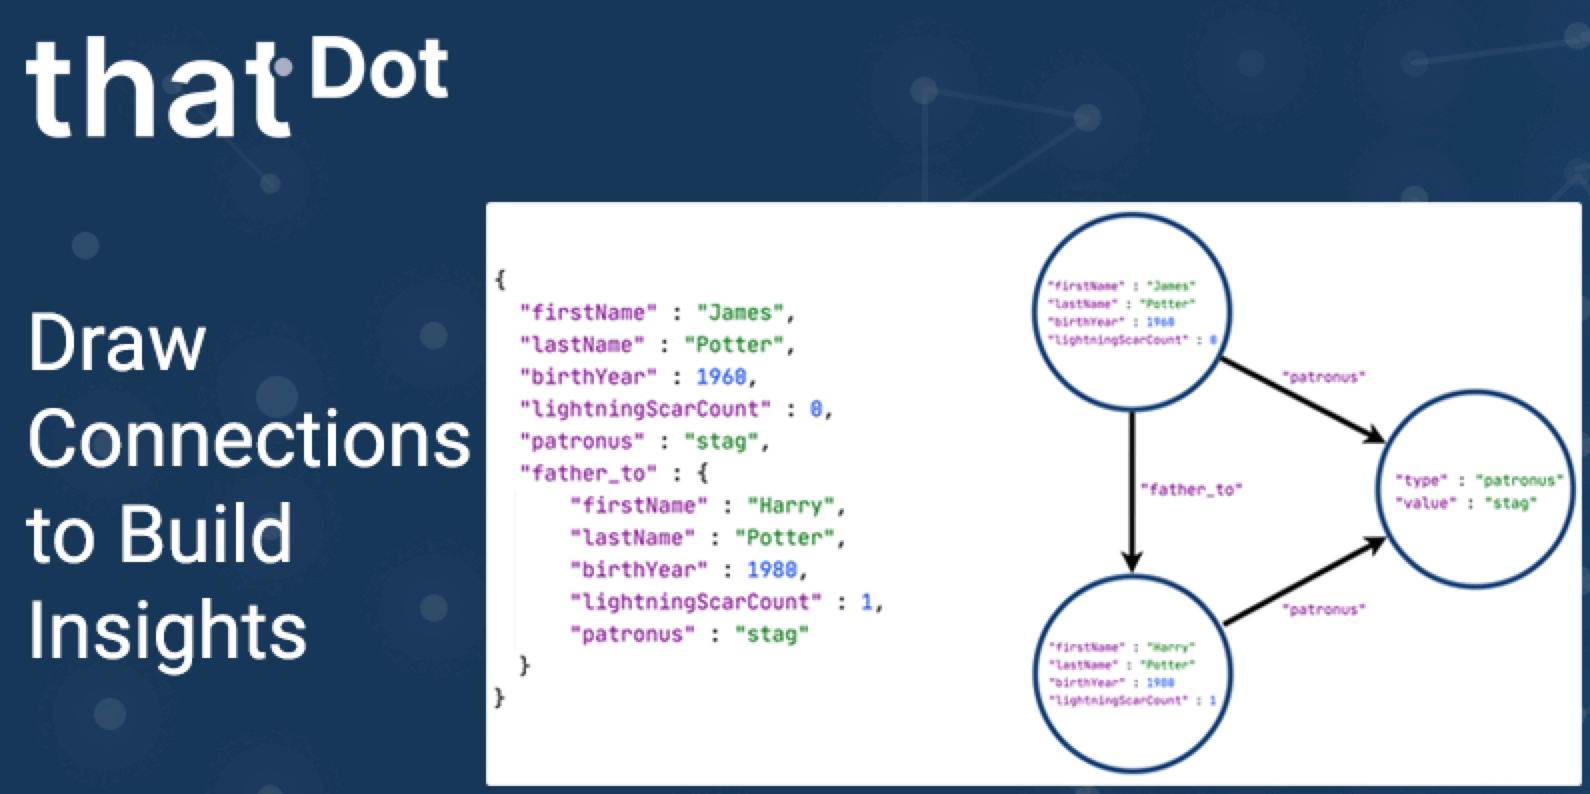
Draw Connections to Build Insights
We introduced the term “3D Data” as a mnemonic and a way to think about streaming data processing that incrementally builds toward human-level data questions.