Getting Started with Streaming Graph
When I started at thatDot six weeks ago, I began keeping a journal of what I learned about Quine, and this new category of software, streaming graph. Journaling helps me organize my thoughts and it is both useful and fun to look in retrospect to see how my ideas and understandings evolved. It is also a great way to distill ideas and share concepts that I find challenging, exciting, or both
And that’s what I hope this post can do for you: give you a good starting frame of reference for streaming graph while instilling in you the same sense of excitement I feel after six weeks of working with Quine.
Start with the questions you need answered.
Before using Quine ask yourself: do I know what question am I trying to answer? If you don’t, and you just want to load as much data as possible into a database and start exploring, Quine offers no great advantage over graph databases.
But if there are patterns of events that you want to watch out for and, when detected, upon which you want to take action , Quine is the right choice.
Consider a few examples:
- you want to detect, then block, fraudulent blockchain transactions as well as identify in real time all parties who transact with the source.
- you collecting sensor readings and real-time environmental data and want to combine them with historical readings and maintenance data in order to anticipate and head off costly outages.
In both cases the approach is the same: you start by identifying the patterns — the collection of events related in a specific way to one another — that indicate a suspect transaction or imminent system failure and what actions should be taken once that pattern emerges.
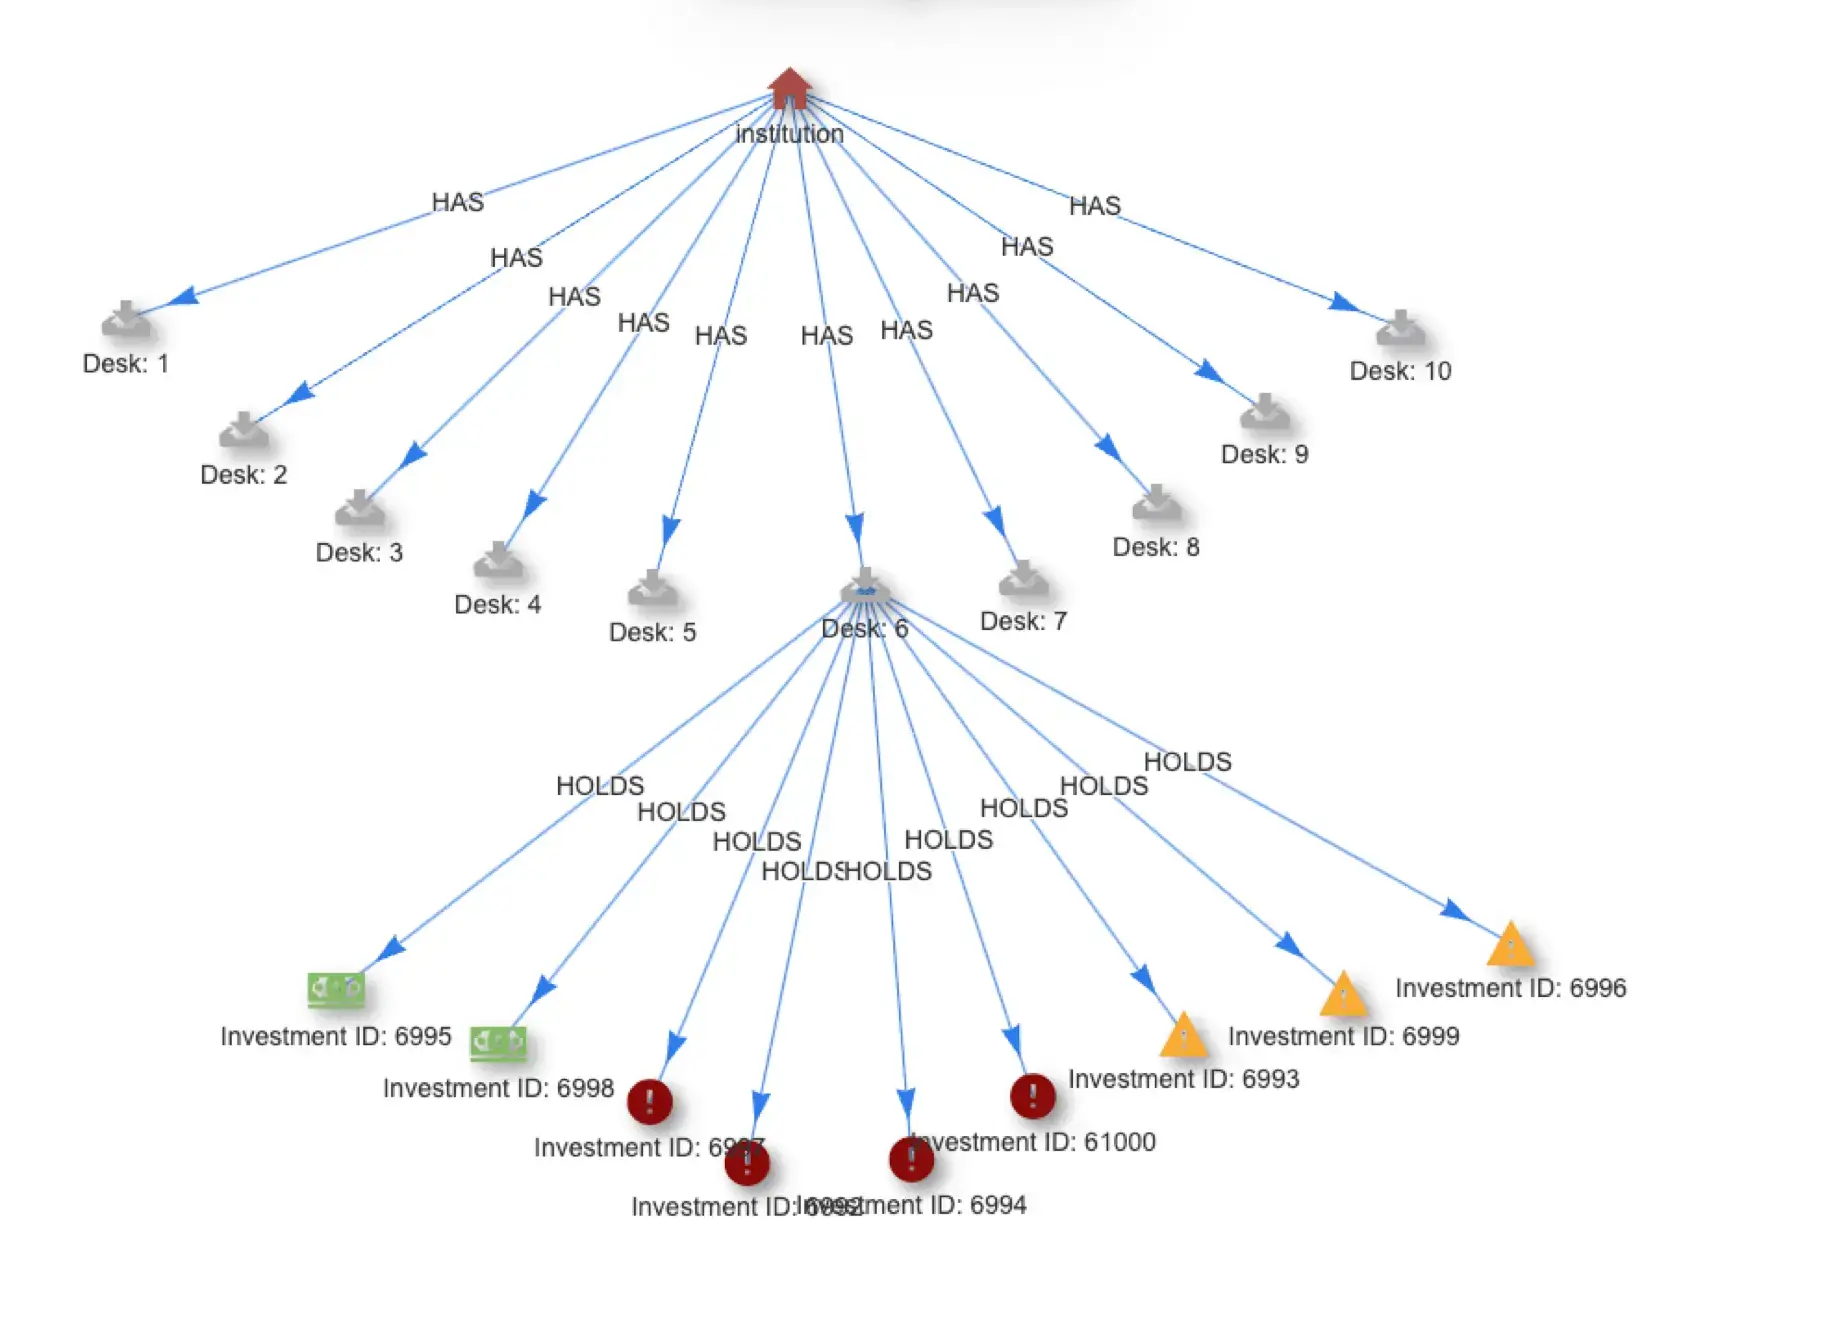
These patterns help to determine which data to represent as nodes, which as properties of nodes, and which as edges expressing the relationship between nodes. Getting this right is the key to building an efficient streaming graph and is the essence of graph data modeling. Because graphs are based on the same subject-predicate-object structure we use to communicate, I personally find expressing data models as graphs straightforward.
Quine streaming graph is a lot like graph databases except when it is not.
Experience with graph databases and graph query languages (especially Cypher) will make getting started with Quine relatively easy. In fact, most of your Cypher queries will just work on Quine. This ease of getting started can lead you to mistake Quine for a traditional graph database.
Quine is much more than a graph database.
Quine was built for a specific purpose – to apply the graph data model so you can detect complex relationships within event streams in real time.
In its simplest form, Quine’s usage pattern is: consume streaming data from Kafka or Kinesis, and shape it into a graph. Then, create queries that find complex patterns among the relationships inside the graph, and trigger some arbitrary action, including modifying the graph itself or writing back out to Kafka or Kinesis.
The key here is finding patterns within streams of data and taking action on the matches in real-time.
If analogies are your thing, the difference between Quine streaming graph and a graph database is the difference between setting a net across a raging torrent to catch what flows through it and casting and recasting a net into a lake until you catch something interesting.
If Quine behaved like a legacy graph database, you’d need to checkpoint the stream, ingest a sampling of data, then query it and subsequent checkpoints continuously until a match was made and only then could you take action. Not only are you expending resources with needless queries, but you are also introducing a delay between when a pattern is complete and action is taken. Instead, using standing queries (more on this later) in Quine, you can trigger an action the instant a match occurs.
This has profound implications on the design and performance of your solution, allowing you to fine tune the graph structure and queries to zero in on the patterns in event data that matter most to you. Or in other words, you still need to develop the questions to ask of your data to solve or, avoid your business concerns.
When and how to work on data: ingest and standing queries.
Quine operates on data using two contexts – ingest queries and standing queries. Together, these control the majority of the interactions you’ll have with the streaming graph.
Standing queries, because they are such a unique and powerful feature of Quine, tend to get a lot of attention. But I’ve learned that the ingest query, while not as flashy, plays a critical role in building an efficient streaming graph.
Think of ingest queries like an ETL processor. They connect to one or more data sources, classify data as nodes, properties of nodes, and may even create edges, then load the data into the graph. The ingest query sets the structure that your questions will take.
Standing queries take over from ingest queries to look for patterns as they emerge from the event streams. The instant a match is made, standing queries trigger actions. Standing queries can send data to an external system (e.g., writing out to Kafka) or perform actions on the graph itself, like creating new nodes, updating properties, or creating and updating edges.

Event driven data in. Data driven data out.
The best way to start learning about the role each query type plays is to look at recipes.
- The Apache Log recipe provides a good example of the ingest query in action, extracting data using regex to create two node types (log, which represents an HTTP request and verb, which represents the HTTP Method). At the same time, it connects the log nodes to their associated HTTP Method using the verb edge. It gives you a great sense of how the structure of the graph maps to the sorts of questions you’d want to ask.
- The CDN Cache Efficiency recipe uses a relatively simple ingest query and showcases the power of the standing query to transform the graph, incrementing counters when there are cache misses and classifying network elements based on reliability.
Putting it all together
With all this in mind – how streaming graph differs from graph DBs, the need to start with the question and work backward, and using recipes to understand the role of ingest and standing queries – pulling down, dissecting, and then modifying one of the advanced recipes is the next logical next step.
I learned a lot exploring the Ethereum Tag Propagation recipe. It uses a live data feed from the Ethereum blockchain and both the ingest and standing queries are robust examples. The Ethereum recipe and the recipes mentioned above are all available as open source on Quine.io.
Interacting with streaming data in Quine opened my eyes to the possibilities of streaming graph solutions. Give it a try yourself. Quine is easy to get up and running from the download page.
Let me know how you do once you’ve had a chance to experiment. Reach out on the Quine community slack channel, I’m @allan. Did you figure out something really cool using Quine? Share your work with the community through Github. Submit a pull request with your recipe and a short description.


