Streaming Graph for Real-Time Risk Analysis at Data Connect in Columbus 2024

After more than 25 years in the data management and analysis industry, I had a brand new experience. I attended a technical conference. No, that wasn’t the new thing. At many conferences, I’ve been surrounded by data scientists, business analysts, data engineers, mathematicians, developers, startup founders, CTO’s, architects, and PHD students, made network connections, listened to giants in the field, like the Chief of Information Management of the United Nations at this one. But, uniquely, at this one conference, Data Connect, organized by Women in Analytics, 9 out of 10 of those leaders in the field were women, and all the speakers were women or a gender minority.
It was a soul-filling feeling. Sometimes, it can feel isolating to be a woman in a technical field, but for 2 days, I was surrounded by smart, capable women encouraging each other and talking shop. I got a copy of Low Code AI signed by Dr. Gwendolyn Stripling who was one of the coolest people I met there, and Unmasking AI by Joy Buolamwini, both of whom gave brilliant presentations.

Risky real-time risk analysis presentation
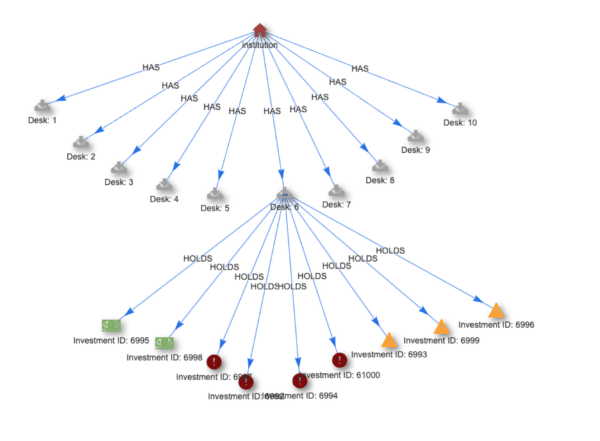
For my presentation, I talked about a way to do powerful risk analysis in real-time. Not too surprising, the method used thatDot Streaming Graph. What was surprising is that I went out of my comfort zone for this deeply technical audience; I did a live demo of the risk analysis recipe. Live demos are always a bit nerve-wracking at conferences, and having never done one before with thatDot tech, well … talk about risky.
The presentation defined risk analysis and pointed out the failure of Washington Mutual, the largest bank failure in US history, and Silicon Valley Bank last year, the second largest bank failure in US history. Both, due largely to poor risk management. Those are just two of the over 550 banks that have failed since the turn of the century. Between a relaxation of government oversight and less than ideal risk calculation, we’re lucky our economy is still functioning.
Since the government regulations aren’t my area, I focused on the problems with current risk analysis methods, mainly that they’re batch and often take 24 or more hours to complete. Even longer if you and your bank HQ aren’t in the same time zone. Since many trades or investments have a regulated time during which a bank can decide to accept the risk and approve the trade or not, usually 24 hours, slow batch processing can expose them far too much.
Most financial institutions are shifting to graph analysis for the entity type of categorical analysis needed, but graph databases don’t scale well to the levels large banks require. Event stream processors scale just fine and are real-time by nature, but they have difficulty with the kind of deep graph analysis. So, you need something with powerful graph analytics at event stream processor speeds to get to real-time risk analysis. The risk analysis recipe uses simulated data, but does a good job of showing the speed of analysis and how it could be done.
The presentation was well-received with one person coming up and telling me they thought it was the best presentation of the conference. Wow. Now, that’s a heck of a compliment considering the caliber of presenters.
I’m looking forward to going to Data Connect again next year, and if you want to learn more about data analysis and data management, don’t miss it.
Related posts
-

The Secret Ingredient in the Alphabet Soup of Cybersecurity
This is the first in a series of blogs exploring how the Quine Streaming Graph analytics engine is the secret ingredient in the Alphabet Soup of cybersecurity, enabling…
-
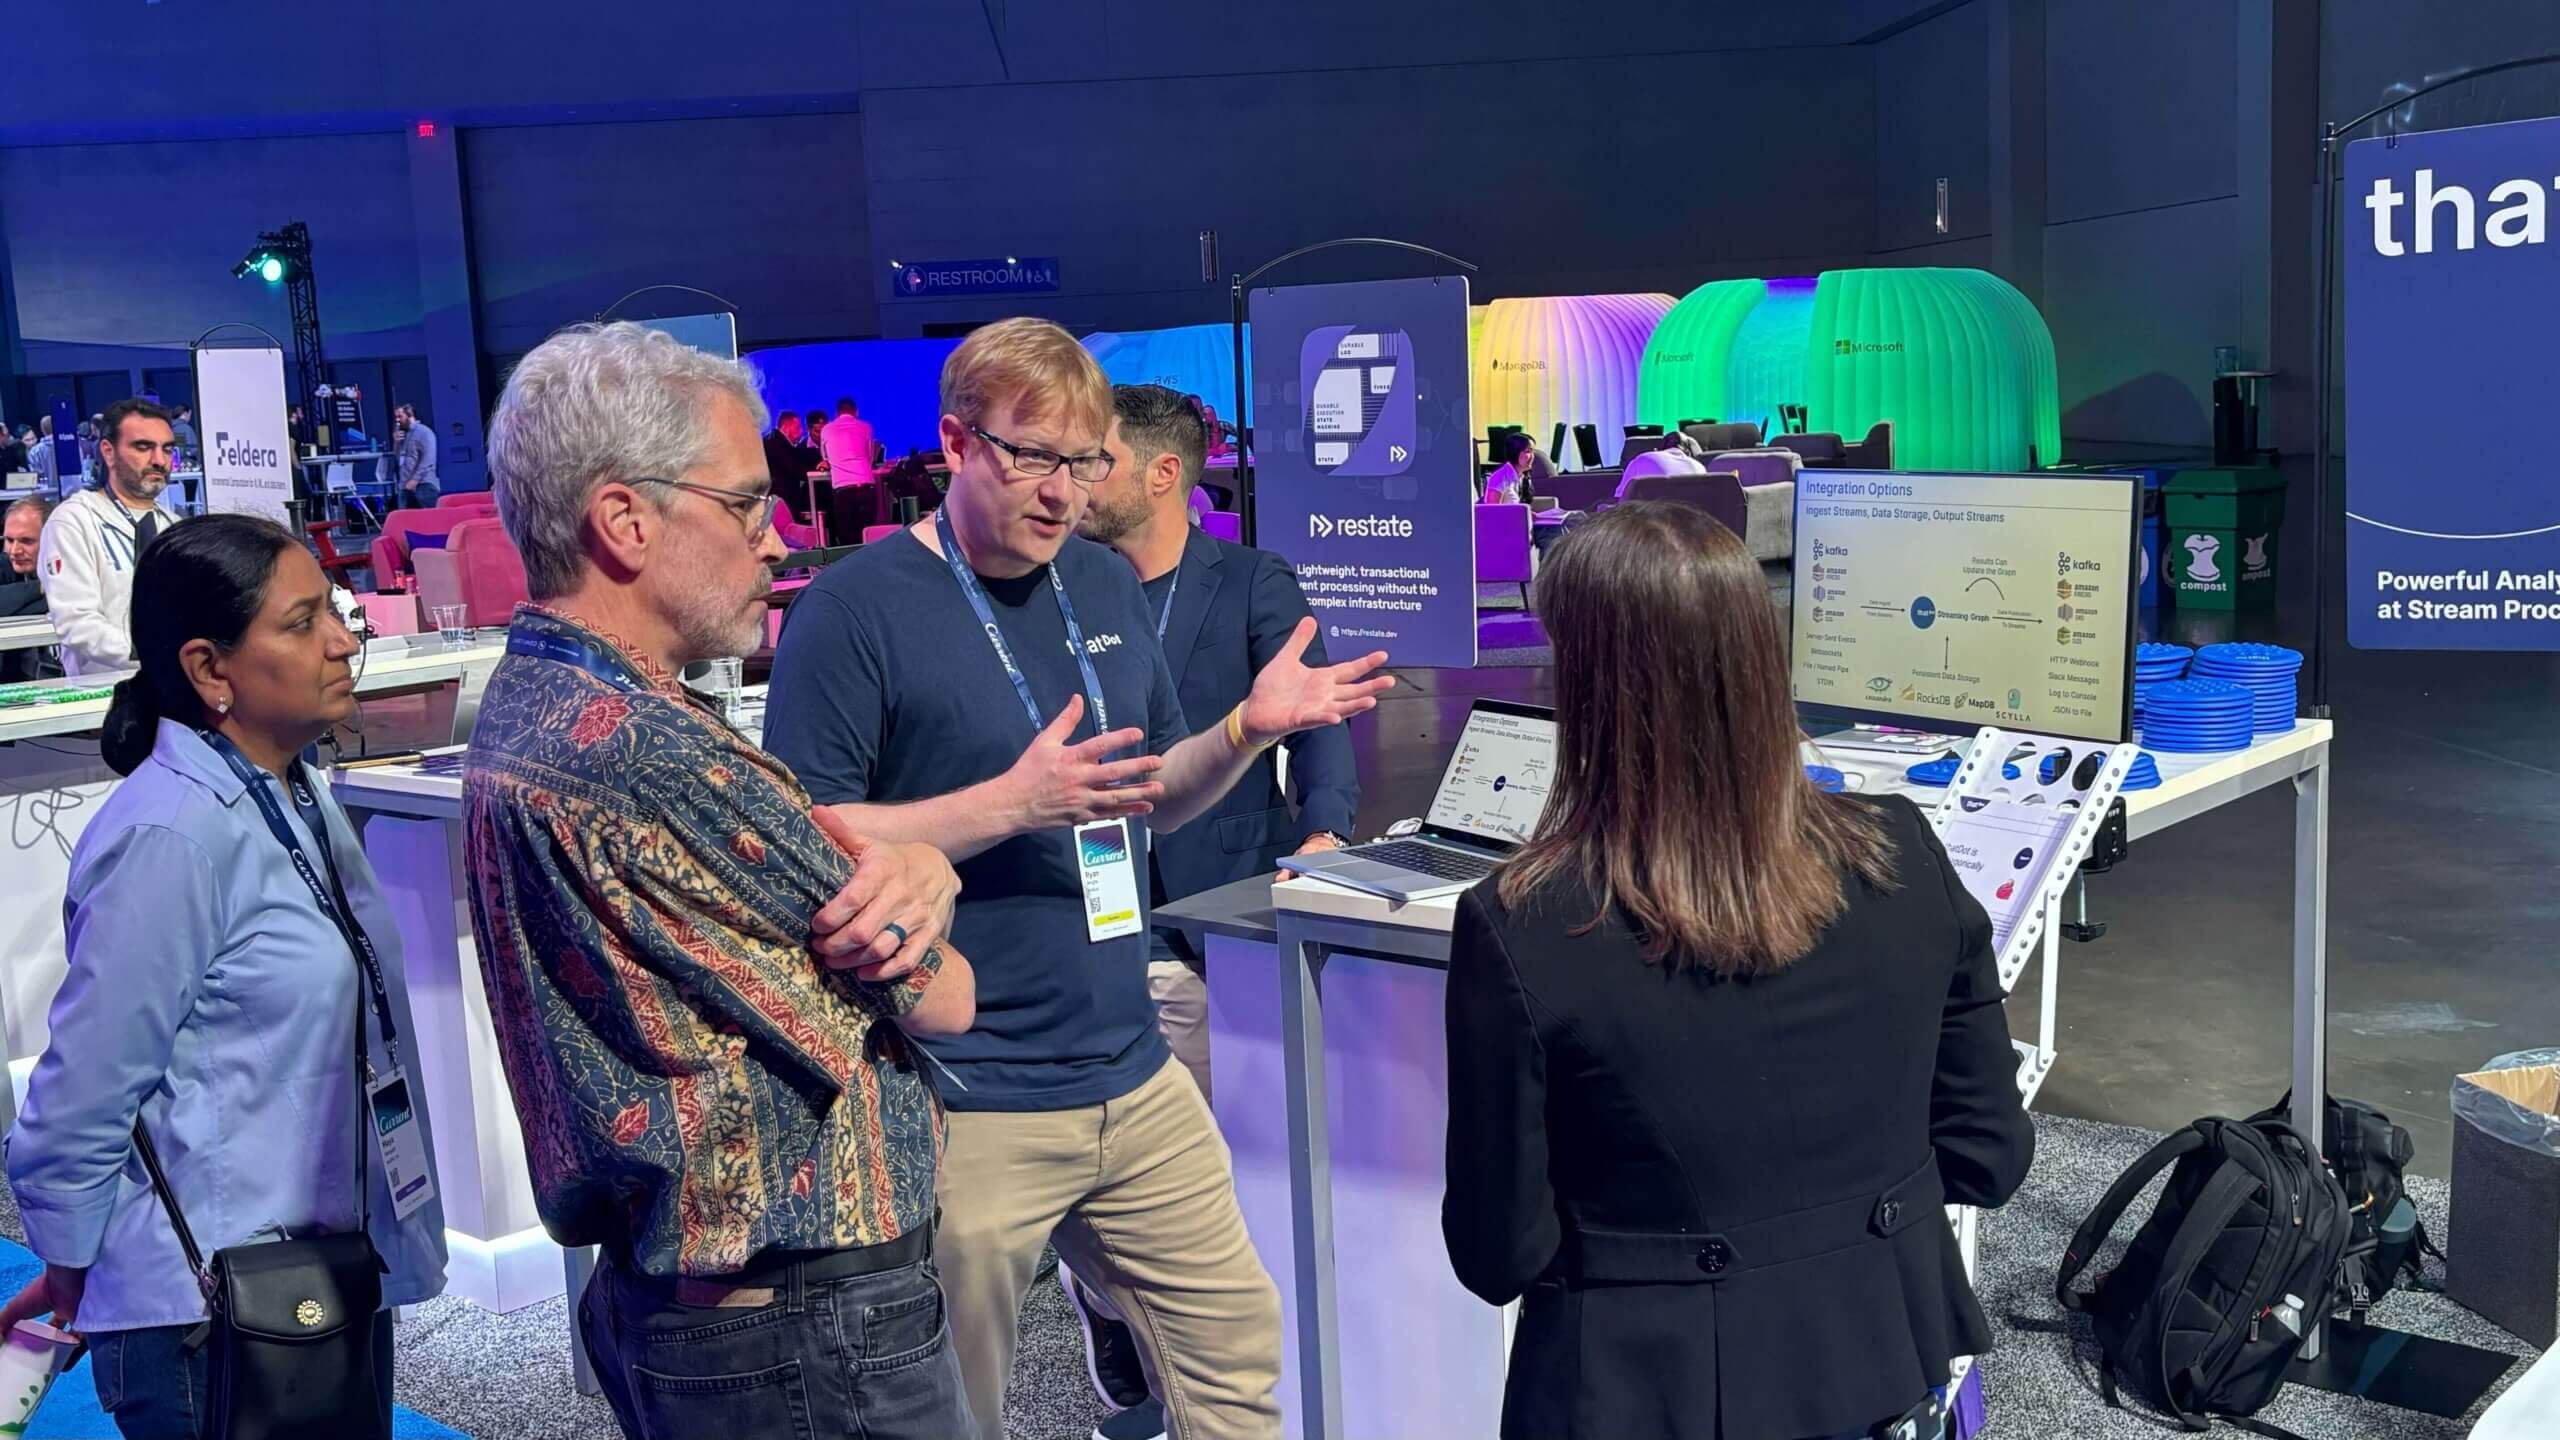
Stream Processing World Meets Streaming Graph at Current 2024
The thatDot team had a great time last week at Confluent’s big conference, Current 2024. We talked to a lot of folks about the power of Streaming Graph,…
-
Streaming Graph Get Started
It’s been said that graphs are everywhere. Graph-based data models provide a flexible and intuitive way to represent complex relationships and interconnectedness in data. They are particularly well-suited…