Quine Streaming Graph: A Year in Open Source
Becoming Developer Focused
Since February, we spent much of our time – whether coding, writing docs, or talking to people – iteratively improving the developer experience: who is Quine built for, what jobs do they tell us they need to get done, what isn’t working for them currently, and what resources do they need to be successful.

As more people started hearing about Quine, mainly through shared blogs, word of mouth and events, we received a lot of feedback that challenged very basic things like how we even talk about Quine.
For example, we heard early that people didn’t really understand what a streaming graph was or where Quine fits in an event stream pipeline. Was it a graph database? What did it even do? All the important foundational stuff.
We realized that we needed to simplify everything: we needed to create or update web pages, documentation and blog posts that were simple, clear, and developer-focused.
Documentation underwent a transformation, with significant focus on the Getting Started and Concepts sections.
Of the 32 blog posts published this year, 23 were either 100% or primarily focused on how engineers and architects can use or better understand the utility of the open source version of Quine.
Highlights include:
- A six part series on ingesting data into Quine
- A deep dive into idFrom and its implications for event streaming (idFrom is Quine’s strategy for maintaining state for a potentially infinite stream of data; Quine deterministically generates known IDs from data)
- A post explaining how to use Quine’s time series-like function: reify-time
- Data de-duping event streams with Kafka and Quine
- Two popular blogs explaining the difference between categorical and numerical data and why it matters in event processing
Strengthening the Community’s Voice
We also hired a dedicated developer relations director – Michael Algietti – whose job is to engage with the community to understand how best we can serve it and guide it toward self-sustainment.
But hiring Michael doesn’t mean we’ve delegated the community to one person and forgotten about it, though. Far from it.
Primarily through Quine slack and events, everyone in the company has supported open source users, answering questions and providing feedback for PRs.
As 2022 ends and 2023 begins, that focus is turning into something special: the first glimmers of a self-sustaining community is beginning to manifest. Community members have submitted code, developers are building production systems using Quine OSS, and people are far more likely to tell us what we can do to improve Quine than they were even four months ago.
In 2023 we will continue to learn along with you to improve Quine. We can’t wait to see how you use streaming graph techniques in your modern data pipelines.
Happy Holidays from the team at thatDot!
Related posts
-

The Secret Ingredient in the Alphabet Soup of Cybersecurity
This is the first in a series of blogs exploring how the Quine Streaming Graph analytics engine is the secret ingredient in the Alphabet Soup of cybersecurity, enabling…
-

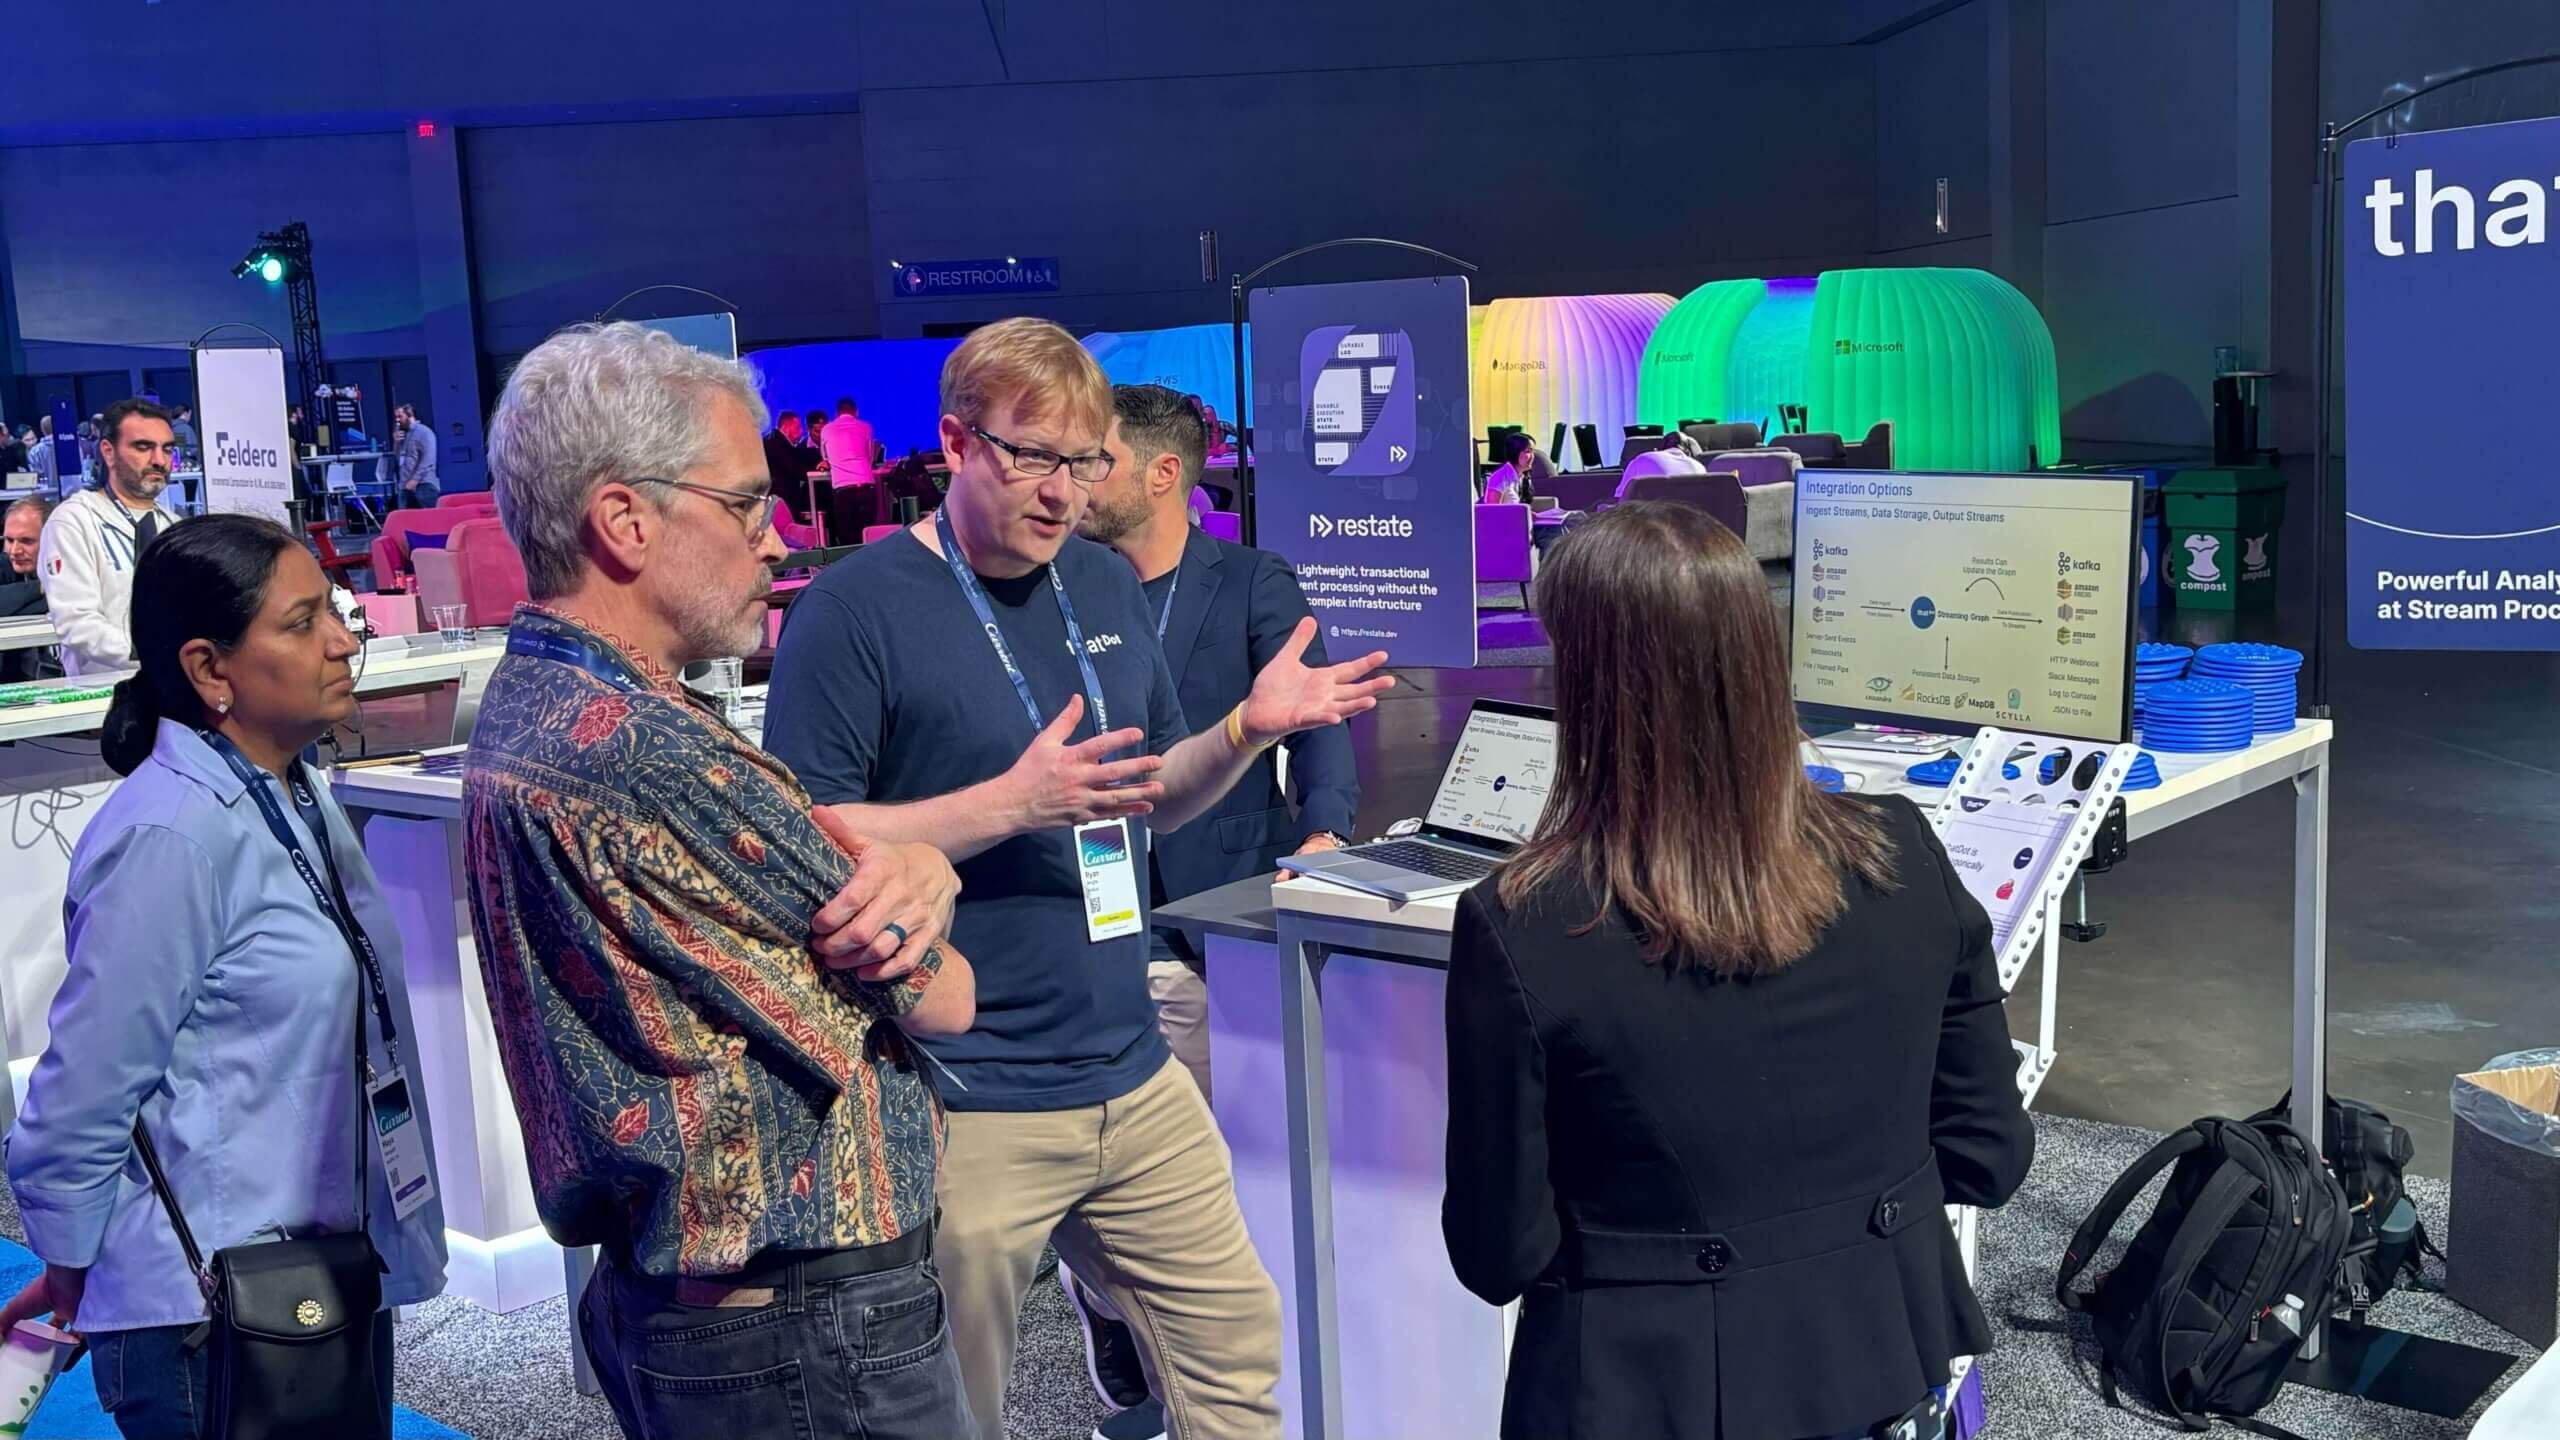
Stream Processing World Meets Streaming Graph at Current 2024
The thatDot team had a great time last week at Confluent’s big conference, Current 2024. We talked to a lot of folks about the power of Streaming Graph,…
-

Streaming Graph Get Started
It’s been said that graphs are everywhere. Graph-based data models provide a flexible and intuitive way to represent complex relationships and interconnectedness in data. They are particularly well-suited…
