thatDot Streaming Graph
Powering the Next Generation of Cybersecurity
Analyze streaming data with the pattern, category, and relationship depth of graph analysis for the toughest use cases like APT detection.
Product Overview
Combine the speed of an event stream processor, with the power of graph analysis.
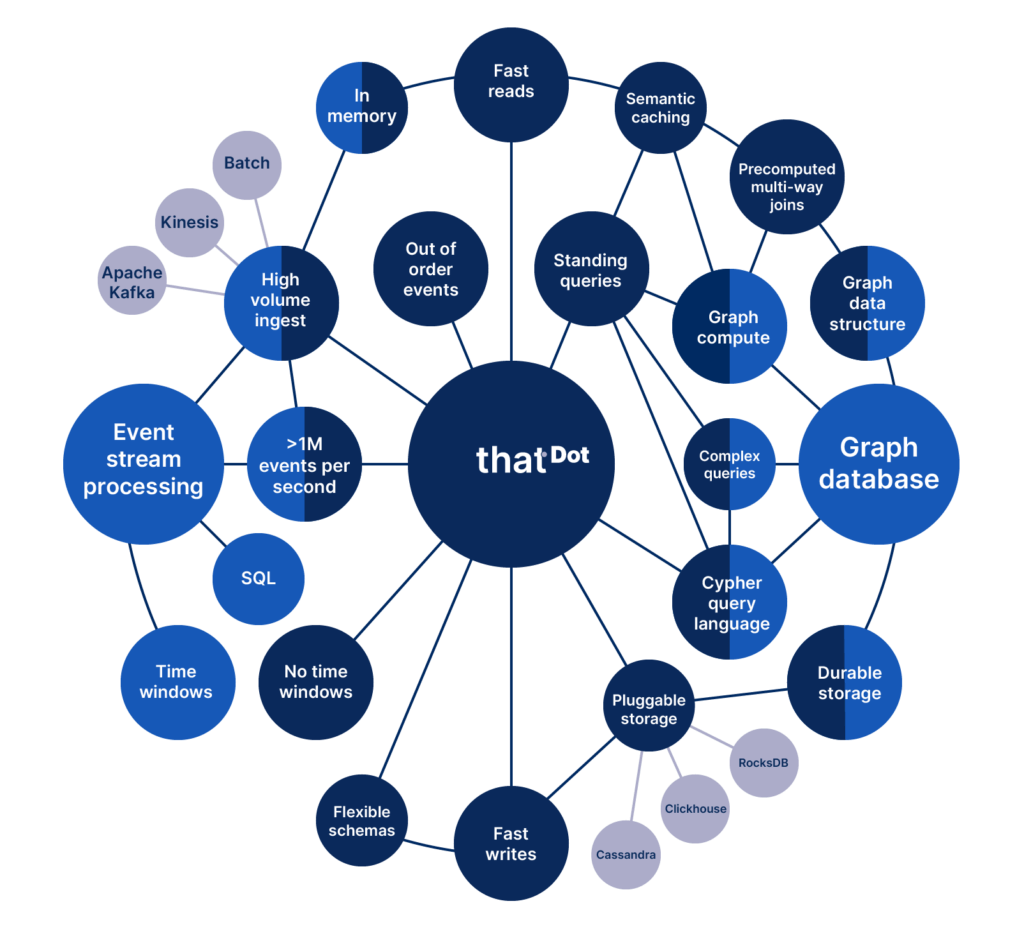
Developed by DARPA for advanced persistent threat (APT) detection, funded by Crowdstrike, thatDot Streaming Graph takes in multiple data streams at once, searches for important patterns formed from past data, data streaming past now, and data that hasn’t arrived. The moment the pattern is complete, it pushes forward the key insights, the dangerous needles in the data haystack.
Ask Categorical Questions
Instead of first converting categorical data into bloated numerical data, do deep analysis on IP addresses, people, things, etc. directly.
Integrate Quickly
Use as both a source and a sink for Apache Kafka, Kinesis, SQS pipelines, and more. Pluggable, interchangeable storage options – Cassandra, Clickhouse, …
Compute at High Speed
Read and write data fast, and handle out of order data with parallelized distributed compute.
Speed Development
Answer tough relationship, anomaly, and pattern questions with the standard Cypher graph query language and robust APIs.
Query Across Time
Find patterns, anomalies, and problems without time windows. Query your entire historical data set plus current data in real-time.
Scale Even on Supernodes
Get unlimited scale – tested throughput of over 1 mill events/second. Supernode problem solved – tested to 100’s of millions of edges.
What its for
A new approach to pattern detection
As data flows in from multiple sources, use Streaming Graph to interpret that data as a graph, to find duplicates, relationships, and categories across the data streams. Set up a standing query that finds the pieces to the puzzle as they flow by. The moment the last piece clicks into place for a pattern you’ve indicated, that data is pushed forward into a new data stream immediately. The mean time to answer (MTTA) can be measured in milliseconds.
Cybersecurity – Threat detection in real time
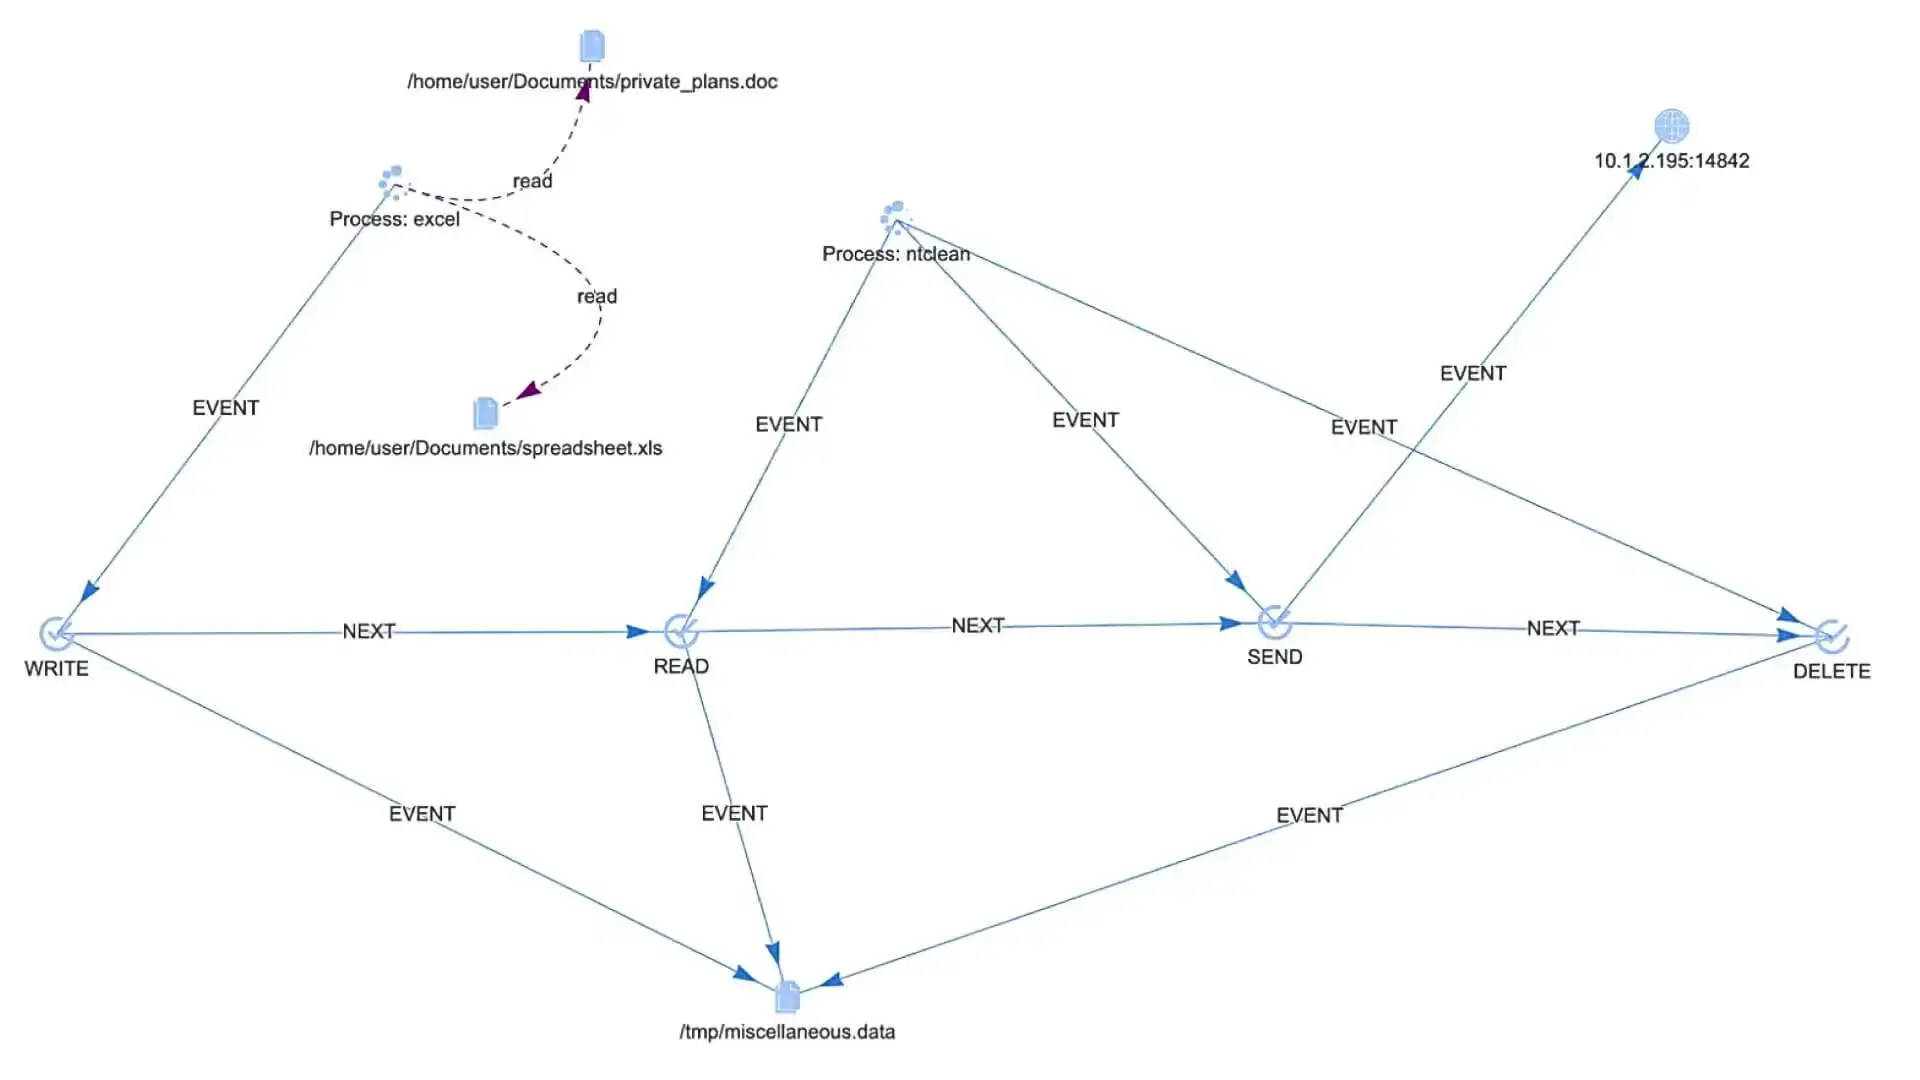
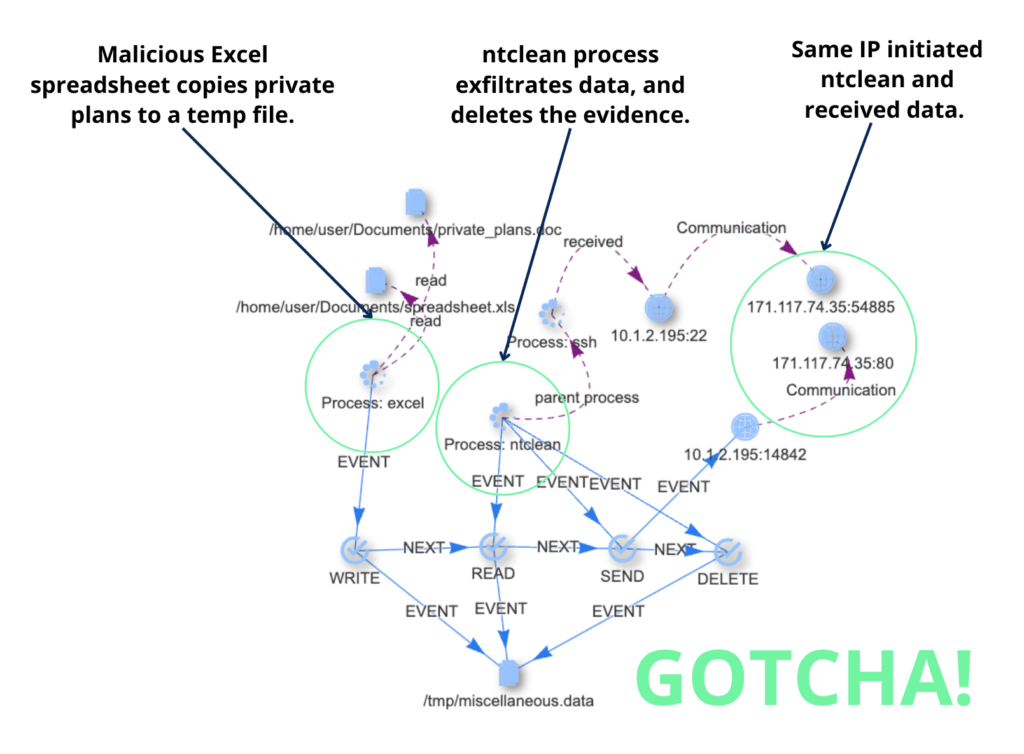
Time window streaming data processor limitations have left our agencies, companies, and infrastructure utilities wide open to attack by bad actors, foreign and domestic, willing to find a way in and wait till those time windows expire. DARPA helped develop Quine, the open source heart of Streaming Graph, so you can spot insider threats, advanced persistent threats (APTs), etc. no matter how much time passes before exfiltration. Catch cybersecurity threats in the act, the moment they start stealing data or damaging internal systems, not days or even months later after the damage is done.
Financial – Risk analysis and fraud prevention
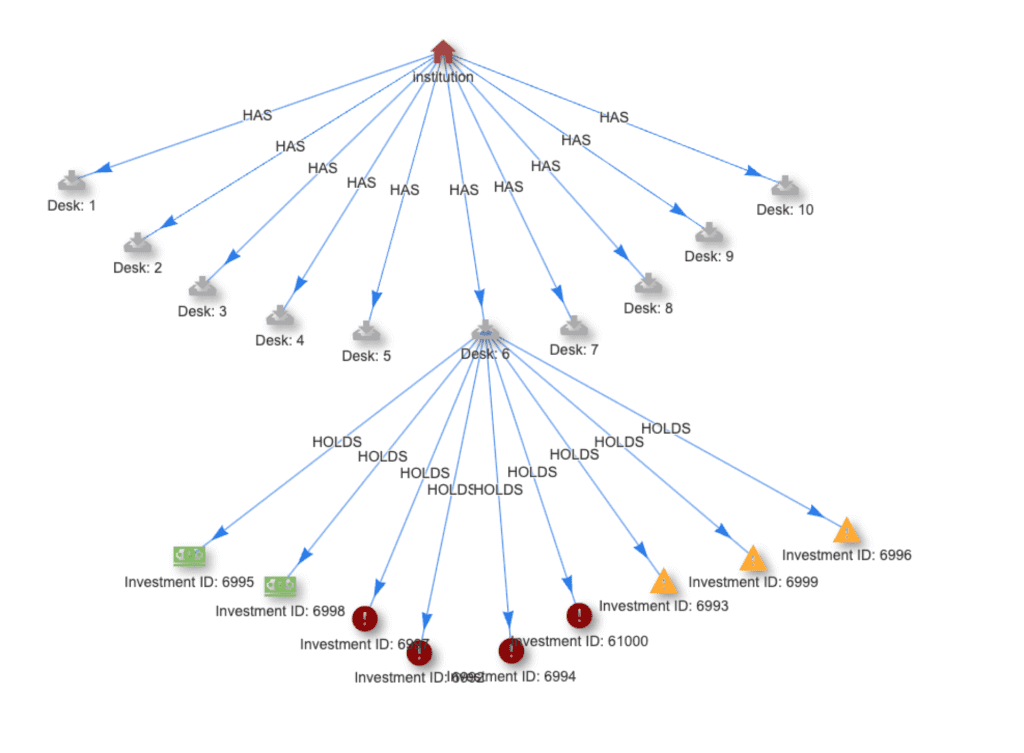
As data from point of sale devices, ATMs, etc flows in, letting it get prepped and dropped in a stationary database before you can analyze it delays fraud analysis until it’s too late to prevent, delays risk analysis until it may be too late to adjust your portfolio or turn down a bad trade without loss. Spot fraudulent financial patterns or shifts in risk exposure within microseconds, while the data is still flowing in.
Embeddable – Smart filter data pipelines and optimize networks
With robust APIs and built-in integration to most streaming pipelines, Streaming Graph takes your application to the next level. Match up disparate device data streams with contextual data that may be stationary, resolve duplicates, intelligently filter out the unimportant, observe IT networks and infrastructure, and analyze network patterns of behavior for problems, bottlenecks, etc. Shift analysis left into the data stream itself to shorten Mean Time to Answer (MTTA) in a variety of use cases.
How It Works
First
Define incoming data streams
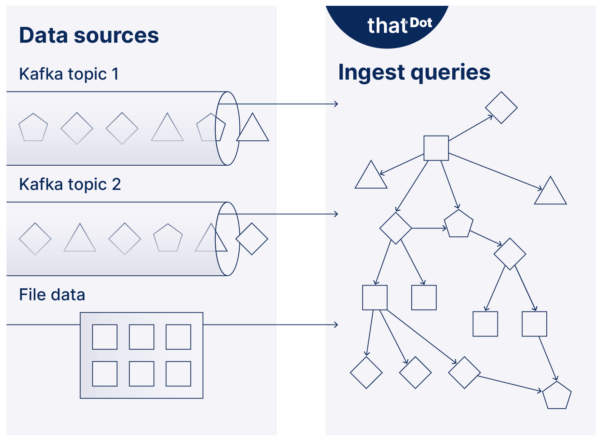
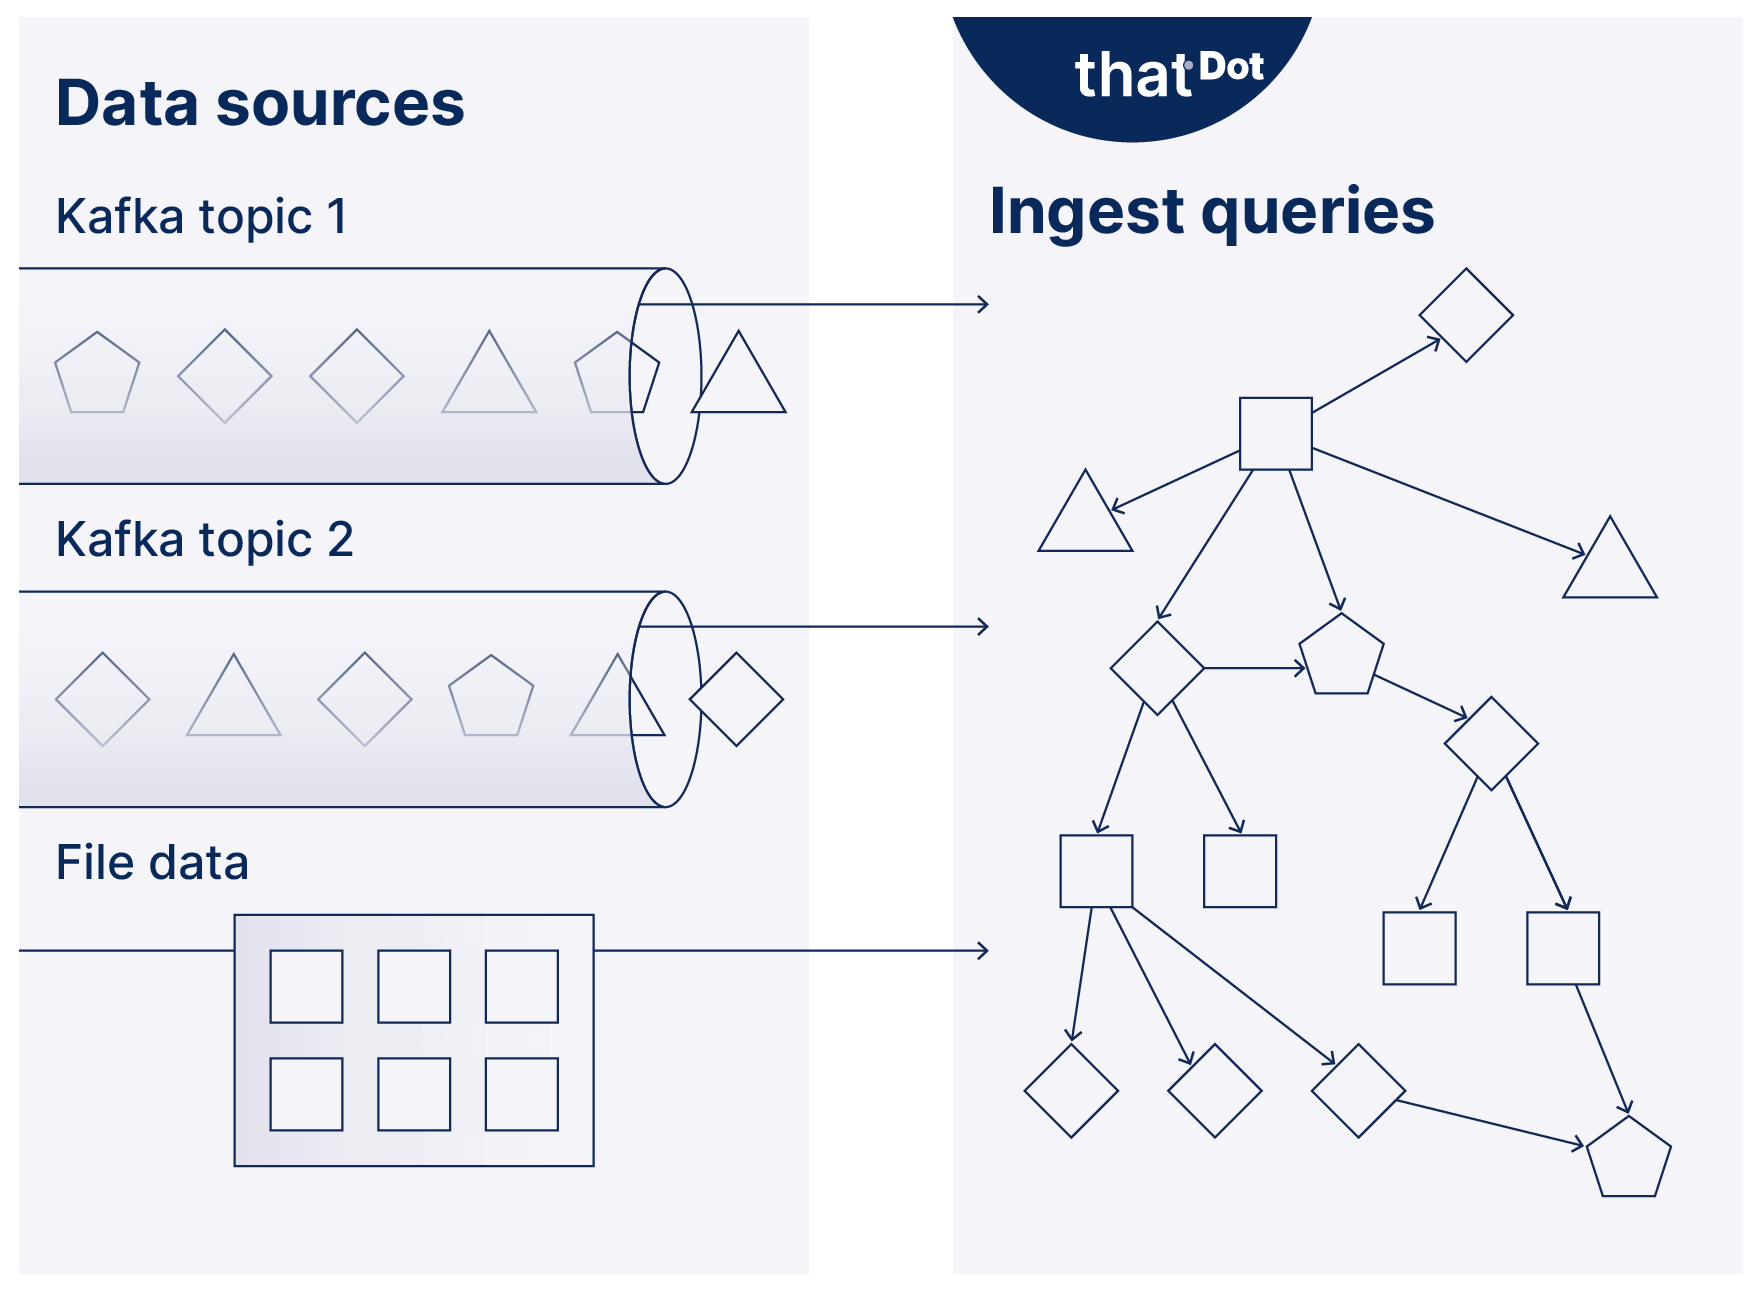
Ingest queries turn incoming data into a graph. First, they indicate what type of data is streaming in, Kafka, Kinesis, SQS, etc. or stationary data from files or more commonly, both at once. Define which topics, files, and devices you want, and finally, define which pieces of data become nodes, relationships, properties, etc. in the graph.
Second
Define the pattern you’re looking for
Define the pattern to watch for with a standing query in the standard Cypher graph query language invented by Neo4J, plus some additions from thatDot to make it work for flowing data. Standing queries don’t depend on snapshots, time windows, or even that a pattern has occurred before. As the data flows through, the graph will morph and change, and the standing query will watch for the pattern you’re looking for to occur.
Third
Find answers immediately
As the data flows in, the graph grows more detailed, shifting dynamically as new data arrives. The standing query watches tirelessly across any length of time for the pattern you defined to appear. When the final piece of data completes that pattern, the results are sent within milliseconds to where you indicated, usually through a new Kafka or Kinesis stream into an application that can act, or a monitoring system. You can also interactively explore the dynamic graph with ad hoc queries, and the standing query getting matched can feed back new information into the graph, or trigger subsequent queries.
Fourth
Drive real-time workflows
Robust APIs and easy integration with existing data streams like Kafka mean the patterns found by Streaming Graph can be embedded in applications, workflows, or event-driven architectures seamlessly. Trigger actions in real-time, alert subject matter experts, and push key information to monitoring software.
Finally
Persist key findings and data
Use pluggable data persistence layers such as Clickhouse or Cassandra, or any Cassandra compatible database, to keep the new insights you’ve gained for later re-analysis, the data needed to regenerate the graph in case of power outages, for audit purposes, or use time snapshots of the graph to train machine learning algorithms such as graph neural networks (GNN).
Recent posts
-
The Secret Ingredient in the Alphabet Soup of Cybersecurity
This is the first in a series of blogs exploring how the Quine Streaming Graph analytics engine is the secret ingredient in the Alphabet Soup of cybersecurity, enabling…
-
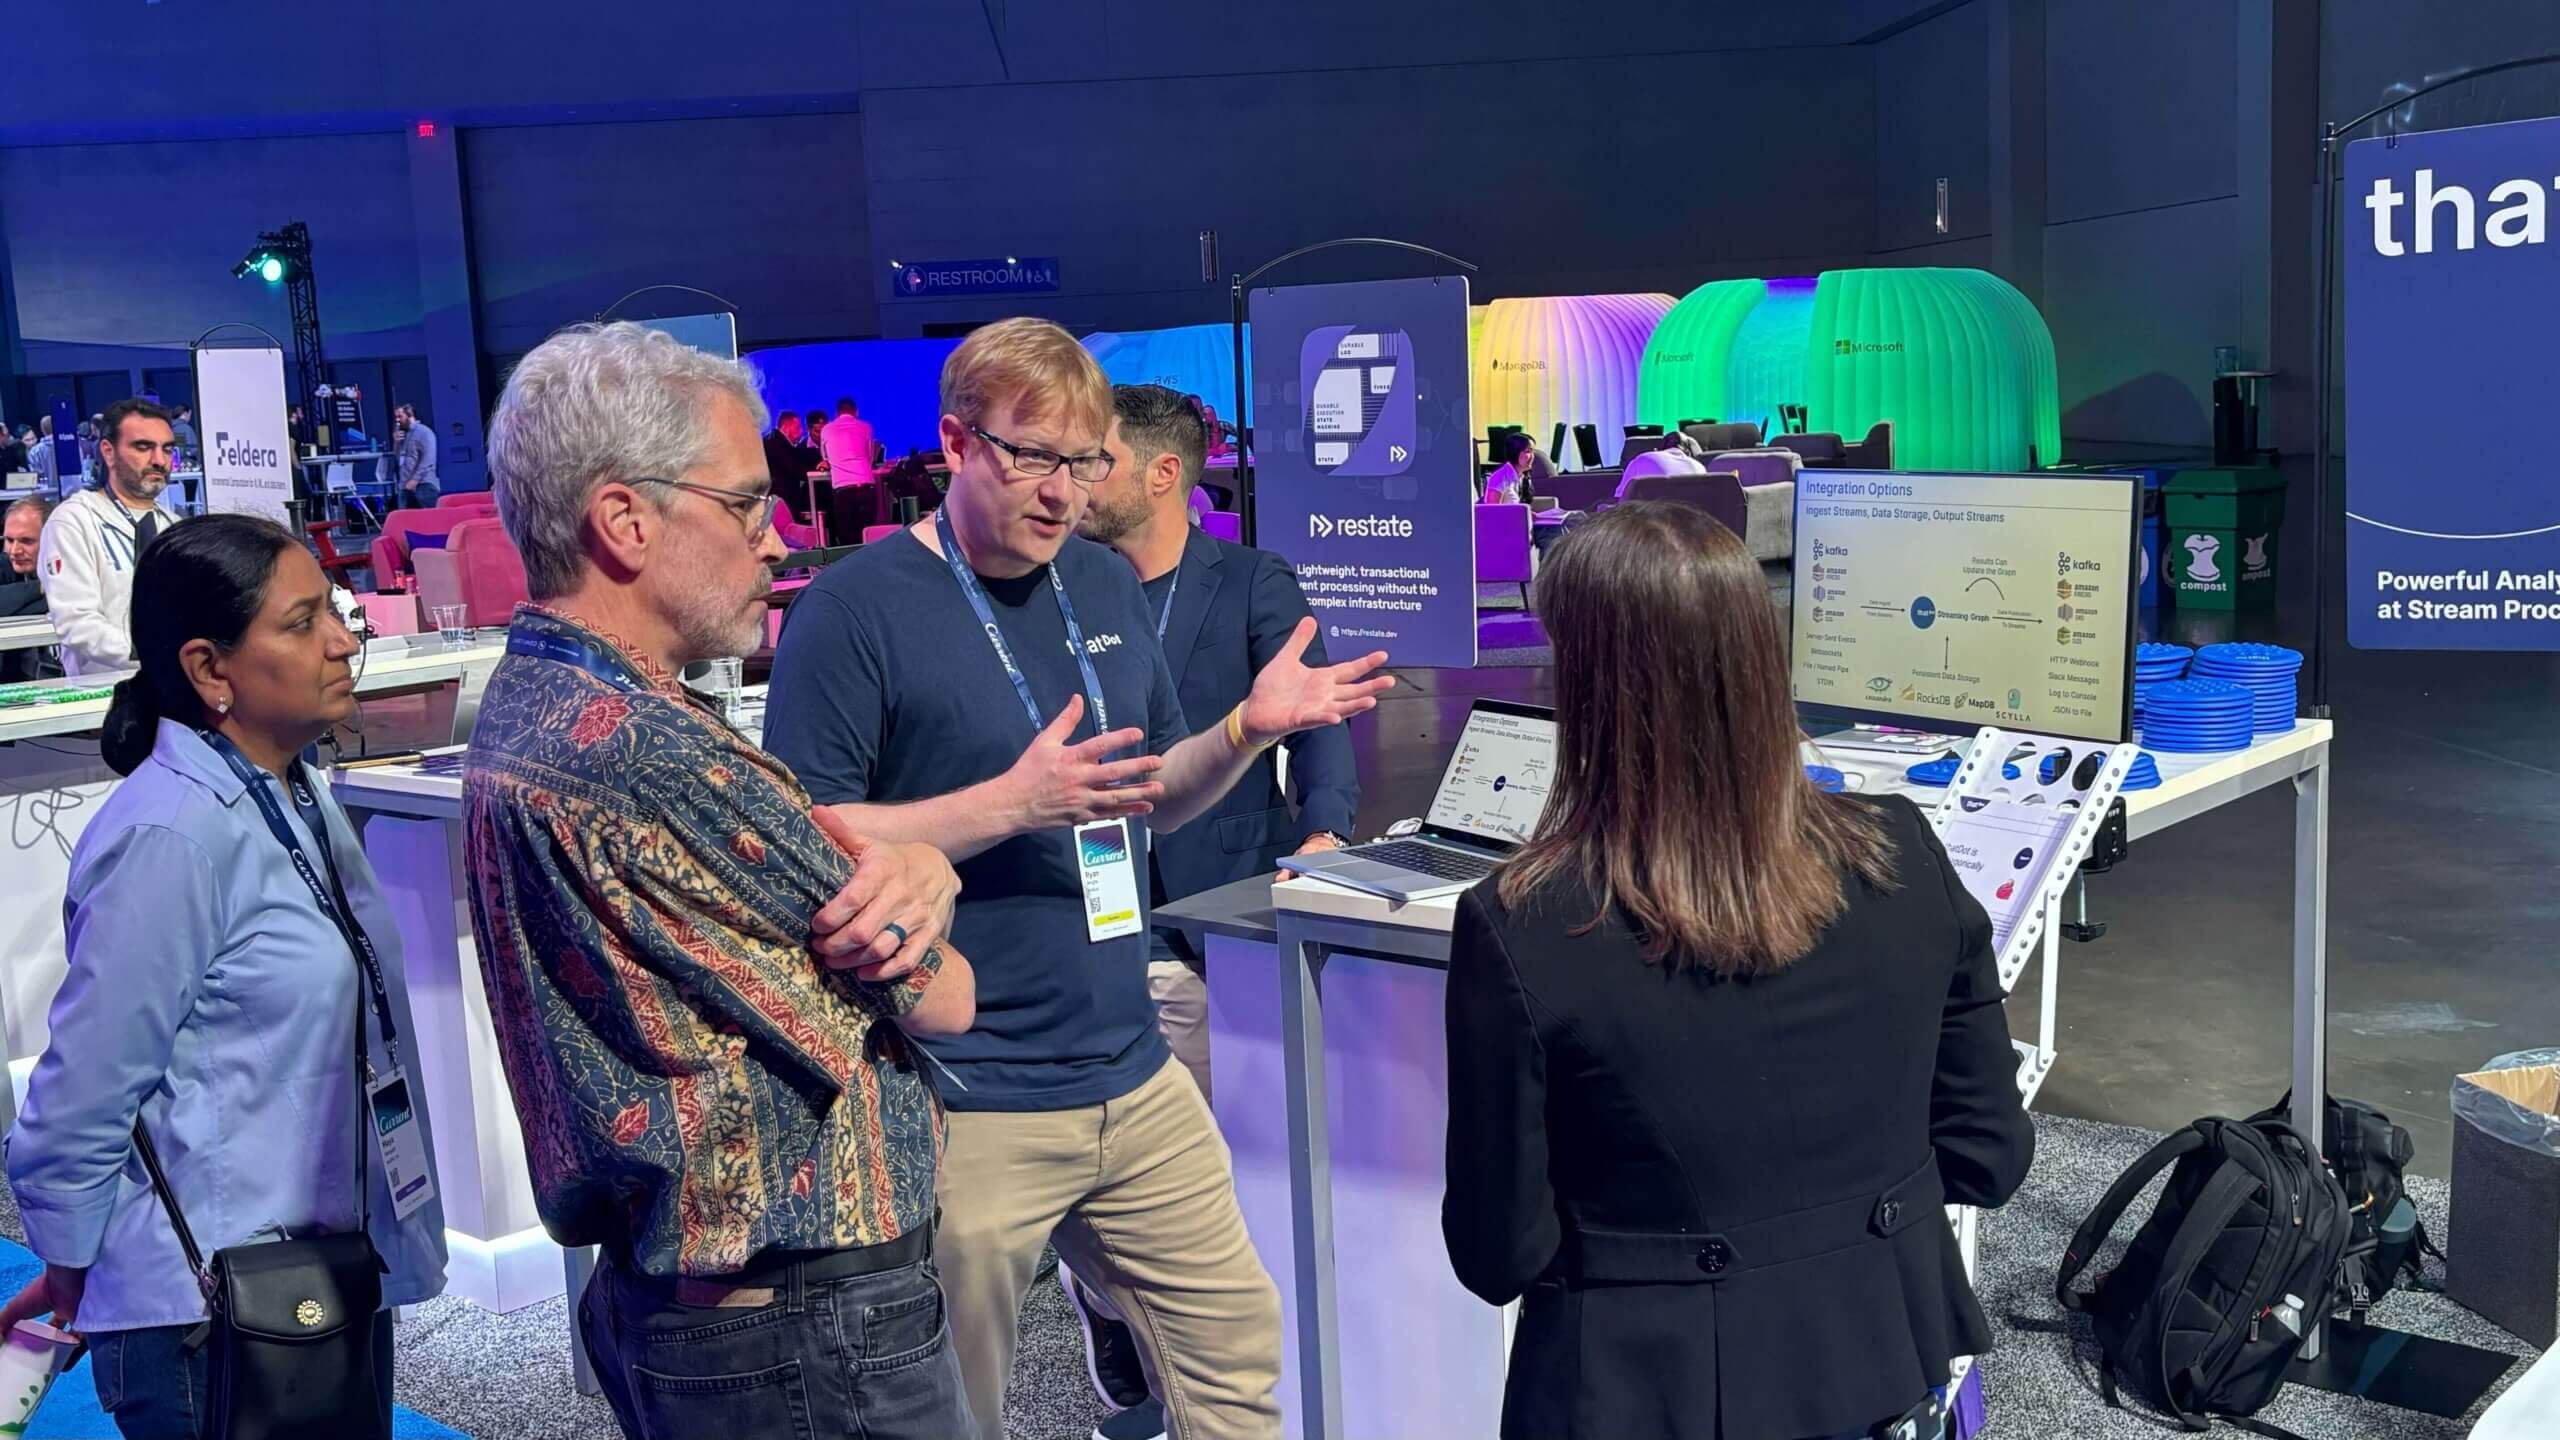
Stream Processing World Meets Streaming Graph at Current 2024
The thatDot team had a great time last week at Confluent’s big conference, Current 2024. We talked to a lot of folks about the power of Streaming Graph,…
-

Streaming Graph for Real-Time Risk Analysis at Data Connect in Columbus 2024
After more than 25 years in the data management and analysis industry, I had a brand new experience. I attended a technical conference. No, that wasn’t the new…
Want to read more news and other posts? Visit the resource center for all things thatDot.
Help Center
Streaming Graph Help
Novelty Help