Modernizing ETL For Cloud
Quine Streaming Graph: A New Approach to ETL for Cloud
Cloud architectures enable and encourage a new level of integration with 3rd party systems and data sources to deliver the enriched and personalized services our users and customers are looking for. Today’s data-driven services place significant new demands on our data pipelines, in terms of scale, agility and flexibility. Recent data pipeline evolution has focused on improving efficiency of existing ingestion workflows, but what we really need is to rethink the objective of data pipelines and let the needed form follow.
If our purpose is to drive event-driven architectures, train AI algorithms and filter big data for valuable data, then the real objective of a modern data pipeline is to assemble, distill and publish only the most relevant data needed to better inform and monitor our software infrastructure. We don’t want big lakes of data, we want small streams of high-value data.
Identifying, processing and packaging high-value data requires a lot from our data pipelines. Unlike ETL of the past, which operated within a limited and deterministic scope between a source and a sink, the cloud-era requires a much broader set of functions:
- Rapid adoption of an ever-growing set of unstandardized data sources
- Accommodating a range of ingestion methods, including files, APIs, and webhooks
- Ingestion of data from a global footprint of partners and sources
- Producing custom formats of data for consumption by our applications
- Real-time processing of data
- Simple management of ongoing ingestion and publication changes
- Ease of use in support of a widening audience of less technical data users
This is a big ask.
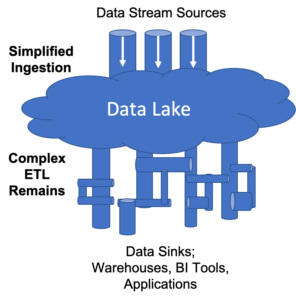
The recent trend towards Data Lakes, Data Warehouses, Data Lake Houses, etc. has solved for some inefficiencies in data pipeline processing by concentrating data operations to avoid duplication of effort and data storage. These solutions, however, do not remove the complexity of downstream processing that is needed to make our data more valuable in terms of timeliness, relevance or insight. Data lakes push data pipeline complexity “underwater”; they do not eliminate it.

Data lakes move data pipeline operational complexity “underwater”
Newer, real-time ETL solutions such as Apache Kafka combined with thatDot’s open source streaming graph Quine, however, promise a more “cloud-centric” approach to data pipeline engineering. These solutions combine multi-modal distributed data ingestion with real-time data transformation and computation, in the data ingestion process itself. The ability to operate on data as it is ingested provides significantly more efficient and simplified data operations, while expanding the range of functions available.
This approach of adding computation to data ingestion also brings a significant advantage in terms of distilling value from our data, turning big data into smart data, before it gets to our applications! This can be especially useful in use cases such as feeding data into ML/AI solutions or for reducing data volume passed to downstream applications.

Embedding compute with ingestion is efficient and delivers real-time ETL
The tight integration of data operations capabilities directly with data streams ingestion delivers the wide range of capabilities needed to deliver on our “modern data pipeline” requirements.
- Efficient – a single system to orchestrate global data ingestion, transformation and publication of data in real time, operated using common tooling and methodologies
- “Cloud” Data Ingestion – graceful accommodation of API and webhook integrations, distributed data ingestion, per-source configurable ingestion adaptors
- Real-time ETL – data is operated upon as it is ingested, combined with historical data as needed from any time window, and directly published to downstream systems
- Out-Of-Order-Data-Handling – Data is processed correctly no matter what order, no matter when it comes in.
- Event Multiplexing – Decompose strings, CSV and JSON data into atomic elements that can be individually transformed and reassembled into custom data for use by downstream services
- Customizable Publication – Extensible operation by individual work groups, allowing them to define data format and transformation operations with common tools
- Manageability & Usability – Cloud-friendly system deployment and management with common tools and methodologies, and a single system path to explore for debugging
It is fantastic when new technologies allow us to increase speed and function, while also reducing complexity. The combination of compute functions with data ingestion provides a new way to meet business requirements, bringing a new level of agility and efficiency to increasingly complex data pipelines.
From Streaming Graph Theory to Practice
We’ve published a series of how-to blogs that take you step-by-step through the ETL process using Quine’s ingest feature. Together with Quine Docs, these blogs will show you how to process high volumes of data with an intelligent, actor-based ETL system that can drive workflows.
- Building a Quine Streaming Graph: Ingest Streams
- Ingesting data from the internet into Quine Streaming Graph
- Ingesting From Multiple Data Sources into Quine Streaming Graph
- Ingest and Analyze Log Files Using Streaming Graph
Next Steps
And if you want to try Quine yourself, you can download it here. To get started, try the Ethereum Blockchain Fraud Detection, Wikipedia Ingest or Apache Log Analytics recipes for different ingest stream examples.
If you have questions or want to check out the community, join Quine slack or visit our Github page.
Related posts
-

The Secret Ingredient in the Alphabet Soup of Cybersecurity
This is the first in a series of blogs exploring how the Quine Streaming Graph analytics engine is the secret ingredient in the Alphabet Soup of cybersecurity, enabling…
-

Stream Processing World Meets Streaming Graph at Current 2024
The thatDot team had a great time last week at Confluent’s big conference, Current 2024. We talked to a lot of folks about the power of Streaming Graph,…
-

Streaming Graph Get Started
It’s been said that graphs are everywhere. Graph-based data models provide a flexible and intuitive way to represent complex relationships and interconnectedness in data. They are particularly well-suited…
